Fig. 1.
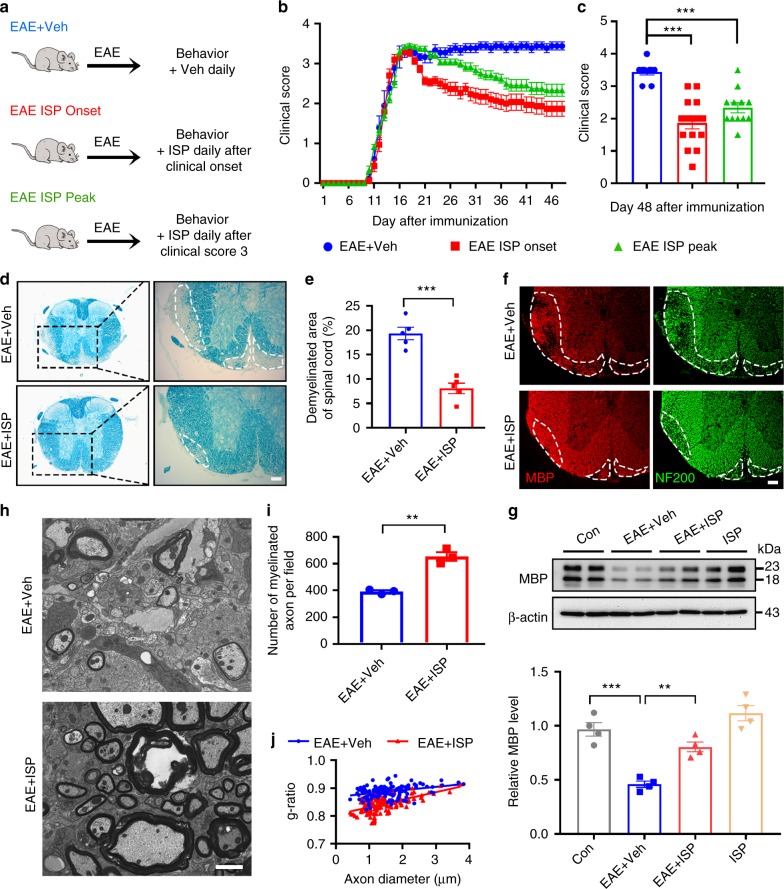
ISP promotes functional and histological recovery in EAE mouse model. a Diagram of ISP administration to EAE mice at the beginning or the peak of sickness determined by clinical score (Created by F.L. and A.P.T.). b Clinical score of disease severity in MOG35-55-induced EAE mice treated with ISP or vehicle daily beginning at the onset or the peak of disease. c Mean improvement in disease score per animal of EAE cohort in B (n = 9 (EAE vehicle group), 15 (EAE ISP onset group) and 12 (EAE ISP peak group), ANOVA F(2,33) = 20.96; Tukey’s multiple comparison test, PEAE+Veh versus EAE ISP onset < 0.0001, PEAE+Veh versus EAE ISP peak = 0.0004). d, e Luxol fast blue (LFB) staining of myelin, demonstrating normal myelin integrity in ISP-treated EAE mice at 48 days post induction, in contrast to the marked loss of myelin present in the spinal cord of vehicle-treated control (n = 5 mice/group, P = 0.0002, t = 6.647, df = 8; Two-tailed unpaired Student’s t test). Dashed lines demarcate lesion areas. Scale bar = 100 μm. f Double immunostaining for MBP and neurofilament-200 (NF200) in the thoracic spinal cord of vehicle- and ISP-treated EAE mice at 48 days post induction. Dashed lines demarcate lesion areas. Scale bar = 100 μm. g Western blot analysis of MBP expression in spinal cord tissue of vehicle or ISP-treated control mice and EAE mice at 48 days post induction. Data are normalized to β-actin protein expression (n = 4 mice/group, ANOVA F(3,12) = 26.68; Tukey’s multiple comparison test, Pcon versus EAE+Veh = 0.0001, PEAE+Veh versus EAE+ISP = 0.0037). h Electron micrographs from ventral lumbar spinal cords of vehicle and ISP-treated EAE mice 48 days following induction. Scale bar = 2 μm. i Number of myelinated axons in the spinal cord lesions of vehicle and ISP-treated EAE mice (n = 3 mice/group, P = 0.0014, t = 7.815, df = 4; two-tailed unpaired Student’s t test). j Quantification of the g-ratios (axon diameter/fiber diameter) of myelinated fibers in the ventral lumbar spinal cords of vehicle and ISP-treated EAE mice (EAE + Veh group, g-ratio = 0.8874 ± 0.001901; EAE + ISP group, g-ratio = 0.8423ISP group; n = 134 remyelinated axons from three mice/group; P < 0.0001, t = 14.31, df = 266; two-tailed unpaired Student’s t test). The data are presented as mean ± s.e.m. *P < 0.05, **P < 0.01, ***p < 0.001

