Fig. 3.
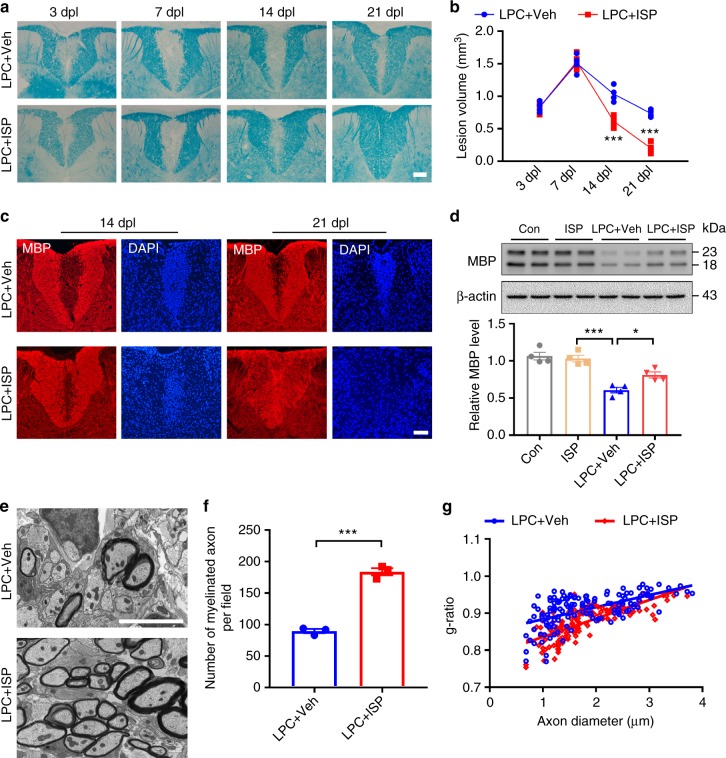
ISP promotes remyelination in the spinal cord of lysolecithin (LPC)-demyelinated mice. a Representative LFB-stained sections of LPC lesions from the spinal cords of vehicle or ISP-treated mice. Dashed lines demarcate lesion areas. Scale bar = 100 μm. b Quantitative analysis of the volume of lesioned spinal cord in vehicle or ISP-treated mice at 3, 7, 14, and 21 dpl (n = 4 mice/group, ANOVA F(3,12) = 16.41; Sidak’s multiple comparison test, 14 dpl: PLPC+Veh versus LPC+ISP = 0.0003; 21 dpl: PLPC+Veh versus LPC+ISP < 0.0001). c Double immunostaining for MBP and DAPI in the spinal cord of vehicle- and ISP-treated mice at 14 and 21 dpl. Dashed lines demarcate lesion areas. Scale bars = 100 μm. d Western blot analysis of MBP expression in spinal cord tissue of vehicle or ISP-treated mice at 14 dpl. Data are normalized to β-actin protein expression (n = 4 mice/group, ANOVA F(3,12) = 24.21; Tukey’s multiple comparison test, Pcon versus LPC+Veh < 0.0001, PLPC+Veh versus LPC+ISP = 0.0276). e Representative electron microscopy images of LPC lesions from the spinal cord of vehicle or ISP-treated mice at 14 dpl. Scale bar = 5 μm. f The number of myelinated axons in LPC-induced lesions from vehicle or ISP-treated mice at 14 dpl (n = 3 mice/group, P = 0.0001, t = 14.26, df = 4; two-tailed unpaired Student’s t test). g The myelin g-ratio in the LPC lesions of vehicle or ISP-treated mice at 14 dpl (LPC + veh group, g-ratio = 0.9103 ± 0.003583; LPC + ISP group, g-ratio = 0.8741 ± 74103599; n = 139 remyelinated axons from 3 mice/group; P < 0.0001, t = 7.142, df = 276; two-tailed unpaired Student’s t test). The data are presented as mean ± s.e.m. *P < 0.05, **P < 0.01, ***p < 0.001

