Figure 3.
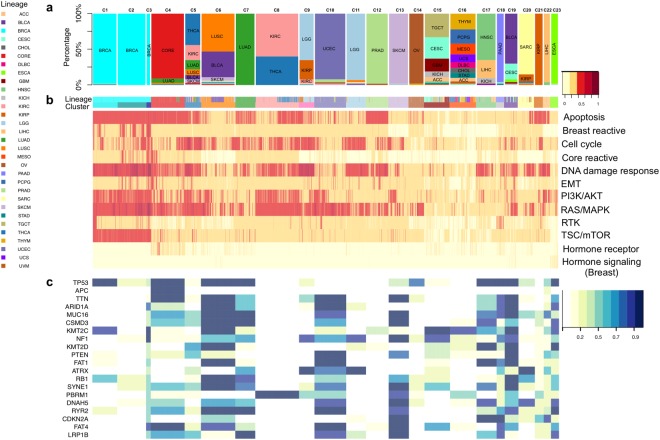
Network-based subtype stratification using PRECISE. (a) Proportions of tumor types represented in each cluster. (b) Heatmap depicting combined activated and suppressed PRECISE scores after unsupervised hierarchical clustering of the score matrix consisting of 6,844 patients across all cancer lineages and 12 proteomic signaling pathways. The scores are indicated on low-to-high scale (yellow-to-red). 23 clusters are defined. Annotation bars include tumor types. (c) Heatmap depicting enrichment probabilities (EP) of mutations for most frequently mutated 20 genes (across all clusters). The probabilities are indicated on low-to-high scale (yellow-to-blue).

