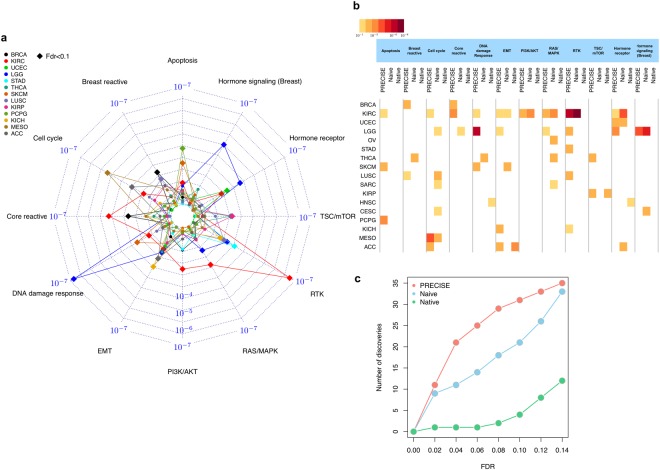
Figure 5.
Supervised learning with survival times based on PRECISE scores. (a) Radar plot for p-values for PRECISE statuses (suppressed, neutral, or activated) using log-rank test for survival times. (b) Heatmap for p-values (high-to-low) with FDR < 0.1 across all 17 cancer types that provides p-values with FDR < 0.1 for at least one pathway and all the pathways, and three different methods, PRECISE, naïve and native. (c) The number of discoveries for the three different methods according to various FDR cutoffs.

