Figure 6.

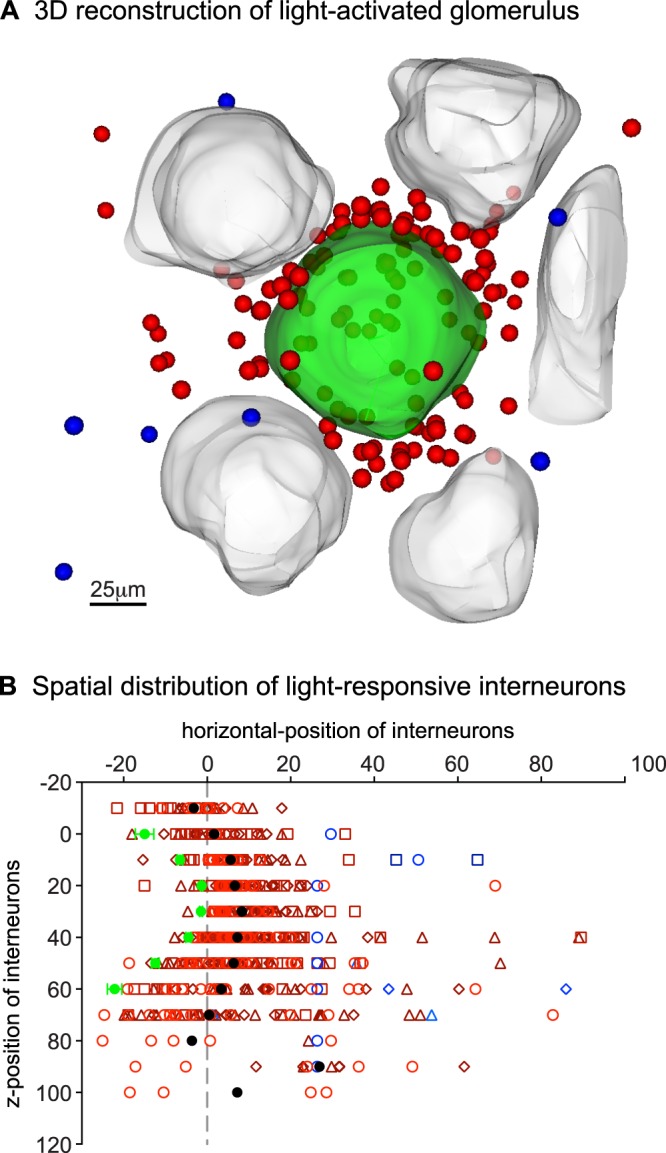
Average distribution of light-activated glomerular interneurons. (A) Three-dimensional reconstruction of the light-activated 7250 glomerulus in a 30-day old mouse. Light-activated cells (red) clustered in the interglomerular space separating the target glomerulus (green) from its non-responsive neighbors (grey). Inhibited cells (blue) are scattered throughout the imaging region. (B) Summarized locations of responding cells in four 30 day-old mice. The x-axis shows positions of the cells and an average glomerular border (solid green circles) with respect to a fixed width cylinder wall (dashed grey vertical line); the y-axis shows the normalized depth of the imaging plane binned to 10 μm intervals. The average glomerulus was 60 μm tall. The solid black circles represent the median distance of cell responses from the edge of the target glomerulus. Red symbols show activated cells while blue symbols show inhibited cells. Symbol shape and shading represent data from different animals.
