Figure 8.
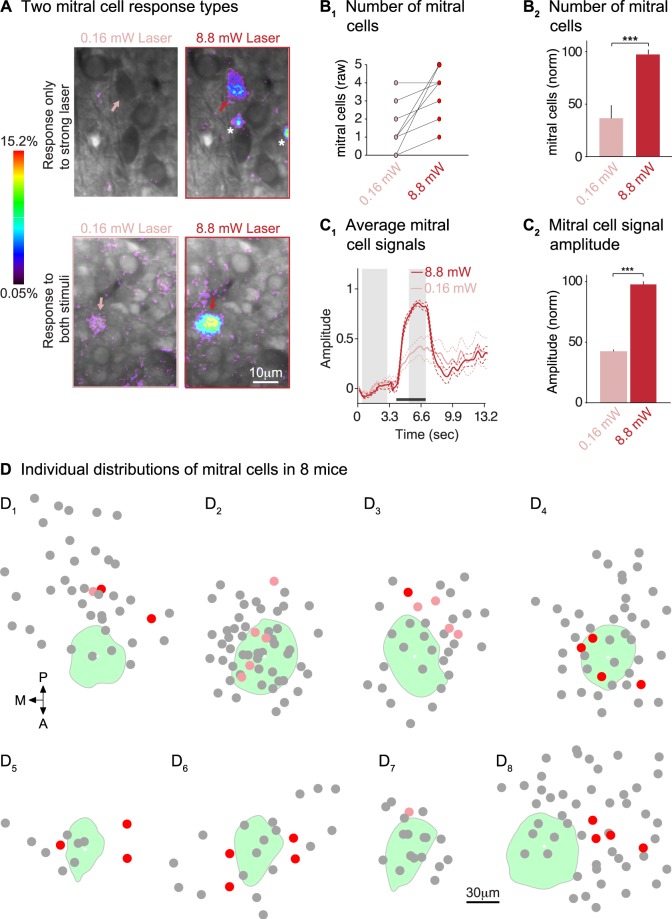
Compact distributions of light-activated mitral cells. (A) Frame subtractions showing two distinct mitral cell signals in response to 0.16 mW vs. 8.8 mW laser stimuli. The top panel shows a cell that responds only to 8.8 mW laser stimuli (arrows). The bottom panel shows a cell that responded to both stimuli (arrows). The scale bar on the bottom right applies to all panels. (B1) The number of mitral cell responses often increased with stronger laser stimuli; shown are data from individual imaging frames. (B2) Significantly more mitral cells responded to 8.8 mWvs. 0.16 mW laser stimulation (9 mice). (C1) Averaged calcium signals recorded from mitral cells during strong and weak stimulation; signals were normalized by dividing traces from matched strong laser vs. weak laser trials with the mean fluorescence intensity during the response by the strong laser stimulus. Dashed lines indicate standard deviations. (C2) Mitral cell calcium signals were significantly larger in the 8.8 mW vs. 0.16 mW stimulus condition (normalized as in C1). (D) Planar distribution of mitral cells around the target glomerulus. Glomeruli are shown in green; mitral cells that responded only to 8.8 mW stimuli are pink dots, while cells that responded to 0.16 mW and 8.8 mW stimuli are red dots. Grey dots are mitral cells that were visible and had an odor response but lacked a laser response. The scale bar applies to all samples.

