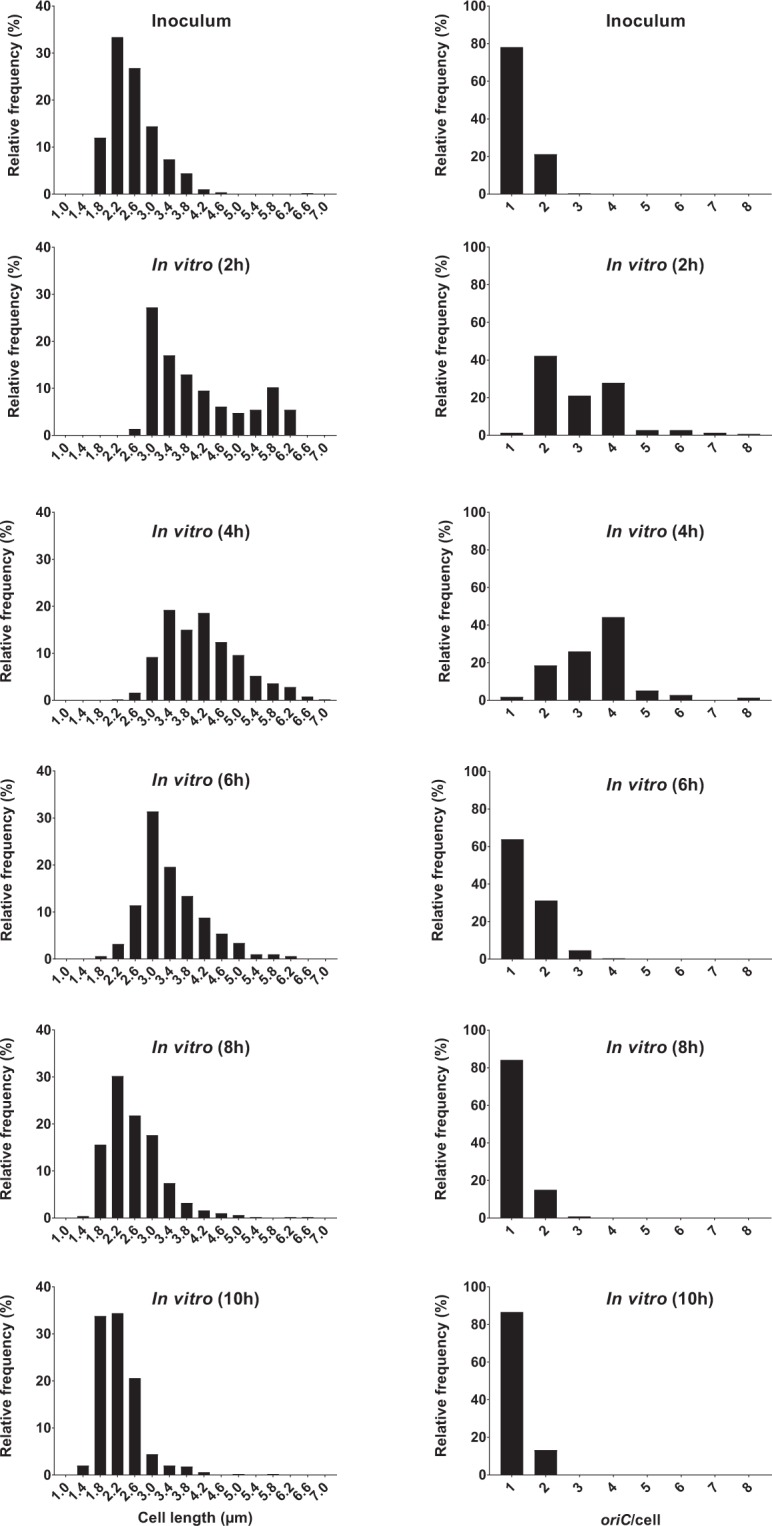
Figure 3.

Relative frequency distributions (%) of pooled microscopically detected bacterial cells (ALO 4783) from growth in LB batch cultures (in vitro); cell length (µm) (left panel) and oriC/cell (right panel). n = 500 at each time point, with the exception of 2 h, where n = 147. Time (h) represents hours of incubation. For oriC/cell histograms, note that data are presented as detected by automated foci quantification, which is subject to the risk of underestimation due to co-localising oriCs48. Hence, it is likely that 3 detected foci truly represent 4 foci and that >4 detected foci truly represent 8 foci (see Methods).
