
Figure 5.
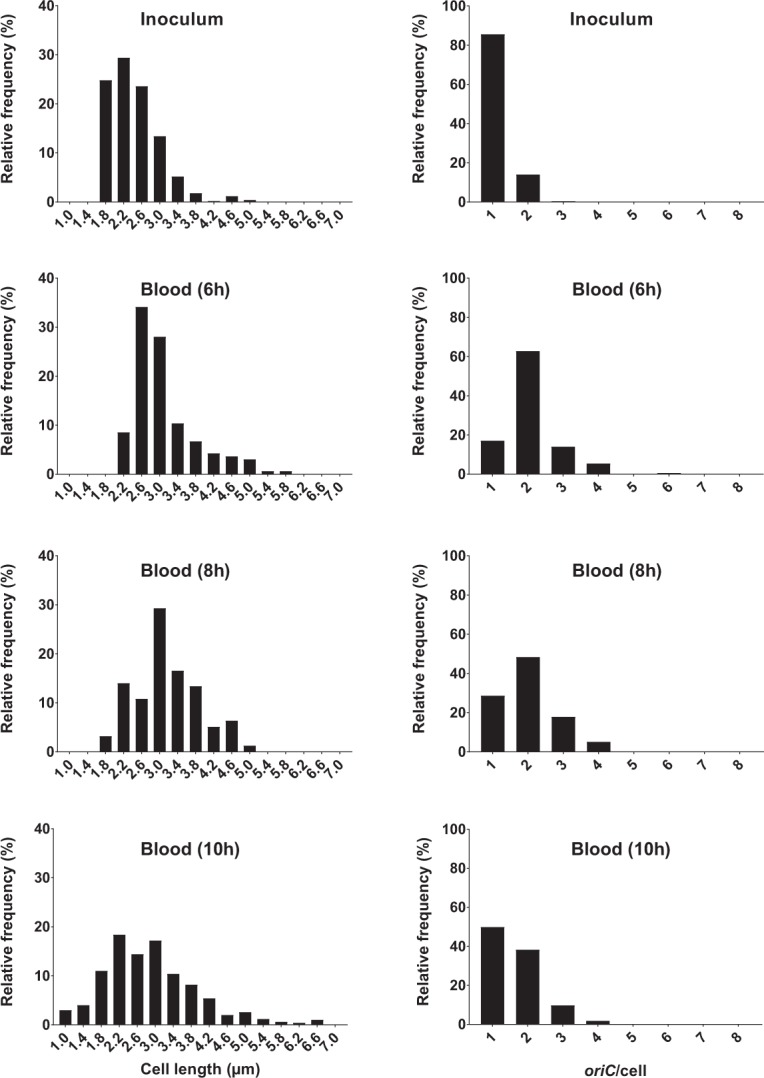
Relative frequency distributions (%) of pooled microscopically detected bacterial cells (ALO 4783) isolated from blood in the mouse peritonitis model; cell length (µm) (left panel) and oriC/cell (right panel). Inoculum, n = 500; 6 h, n = 164; 8 h; n = 157; 10 h, n = 500. Data from 2 and 4 h are not presented, due to insufficient number of microscopically detected cells (Supplementary Table S1). Time (h) represents hours of infection.