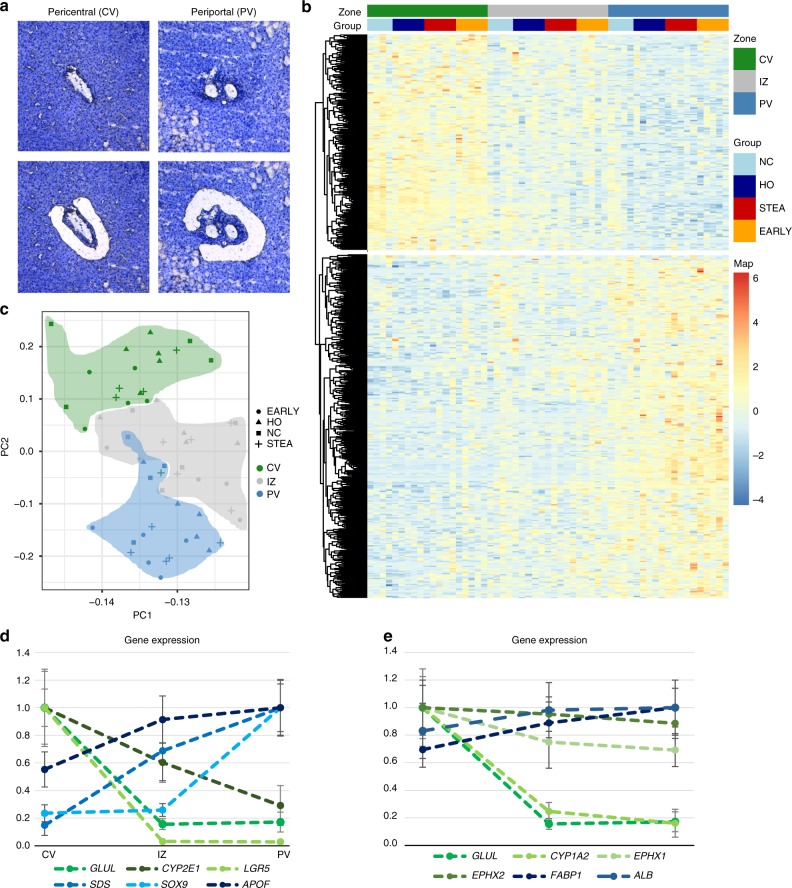
Fig. 1.
Transcriptional zonation along the porto-central axis. a Representative image of laser microdissection of pericentral (CV) and periportal (PV) hepatocytes before LCM (upper images) and after LCM (lower images). b Principal component analysis of the 1000 most variable genes. Pericentral (PC) is coloured in green, the intermediate zone (IZ) in red and periportal (PV) in blue. Symbols correspond to phenotypic groups. c Expression z-scores of zonated genes at pericentral, intermediate and periportal zones (N = 19). Zonated genes (805) were determined using edgeR with |log2FC| > 1 and FDR < 0.01 between pericentral and periportal samples and clustered by correlation. The annotation legend displays controls (NC) in light blue, healthy obese (HO) in dark blue, steatosis (STEA) in red and early NASH (EARLY) in orange. d Normalized expression (including standard deviation) of genes with previously described zonation in mouse liver in human pericentral, intermediate and periportal zones. Dashed lines are for visualization only. e Normalized expression (including standard deviation) of genes previously described as zonated in human liver in the CV, IZ and PV zones, based on immunohistochemistry and in situ hybridization for GLUL, ALB17, EPHX, CYP1A222, CYP1A214 and FABP14. Dashed lines are for visualization only

