Fig. 4.
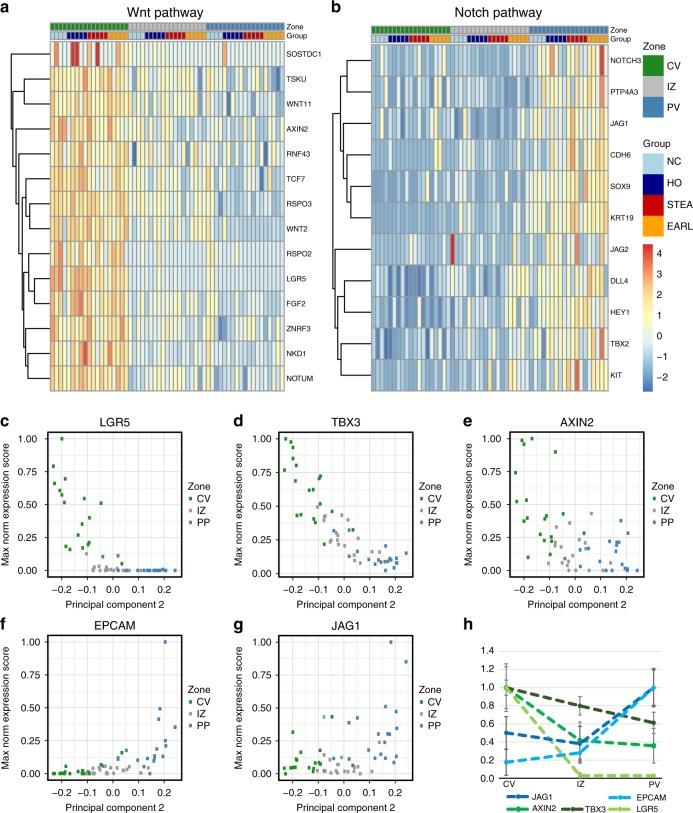
Morphogen gradients and regulatory networks along the porto-central axis. a Expression z-scores of Wnt signalling pathway genes (GO:0016055, GO:0090263, GO:0030178) show a gene-specific zonation signature. b Expression z-scores of Notch signalling pathway genes GO:0007219. c–g Zonation profile of transcripts for morphogens LGR5, AXIN2, TBX3, EPCAM and JAG1. The x-axis is the principal component 2, as a measure for zonation (Note, for visualization reason the PCA2 axis was inverted). h Direct normalized gene expression (including standard deviation) of the morphogens depicted in c–g dissected from the pericentral, intermediate and periportal zones. Dashed lines are for visualization only

