Figure 1.
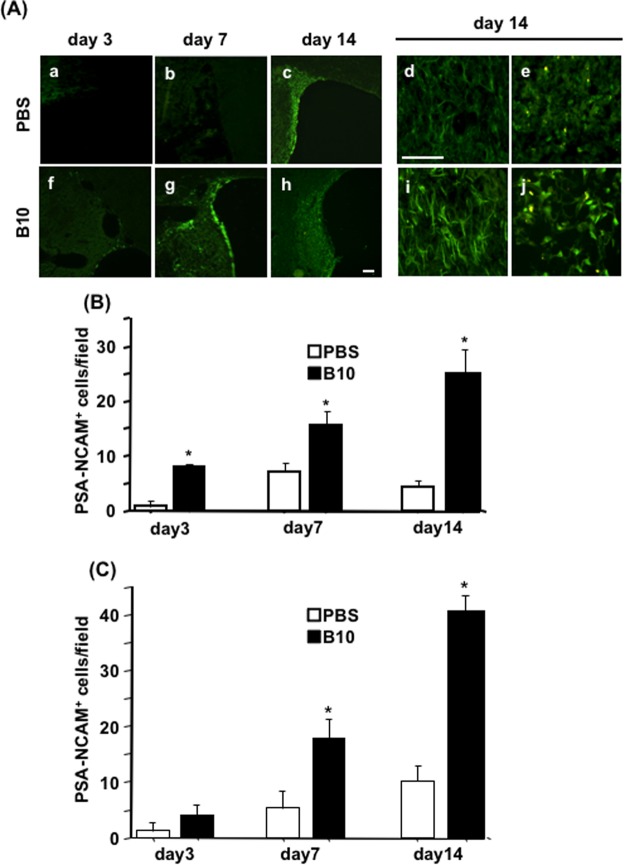
Temporal and spatial distribution of PSA-NCAM+ neuronal progenitors in the rat brain after MCAO. (A) To determine the distribution of neuronal progenitor cells in MCAO rat brains, immunofluorescence staining for PSA-NCAM was performed, as described in the Materials and Methods. The distribution of PSA-NCAM+ cells in the SVZ area of PBS (a–e) and B10 transplanted (f–j) rats at day 3 (a and f), day 7 (b and g) and day 14 (c and h) are shown at low magnification. The distribution and morphology of PSA-NCAM+ cells at day 14 in penumbra and core of PBS (d and e) and B10 transplanted (i and j) rats are shown at higher magnification. Scale bar is 100 μm in (a–c and f–h), and 20 μm in (d,e,i and j). PSA-NCAM positive cells in penumbra and core regions at day 3, 7 and 14 after MCAO were counted at X400 magnification and shown in (B,C), respectively. Numerical data are presented here as mean ± standard error of means (n = 5). Statistical significance was denoted as follows: *p < 0.01 vs PBS group of same time point.

