Figure 5.

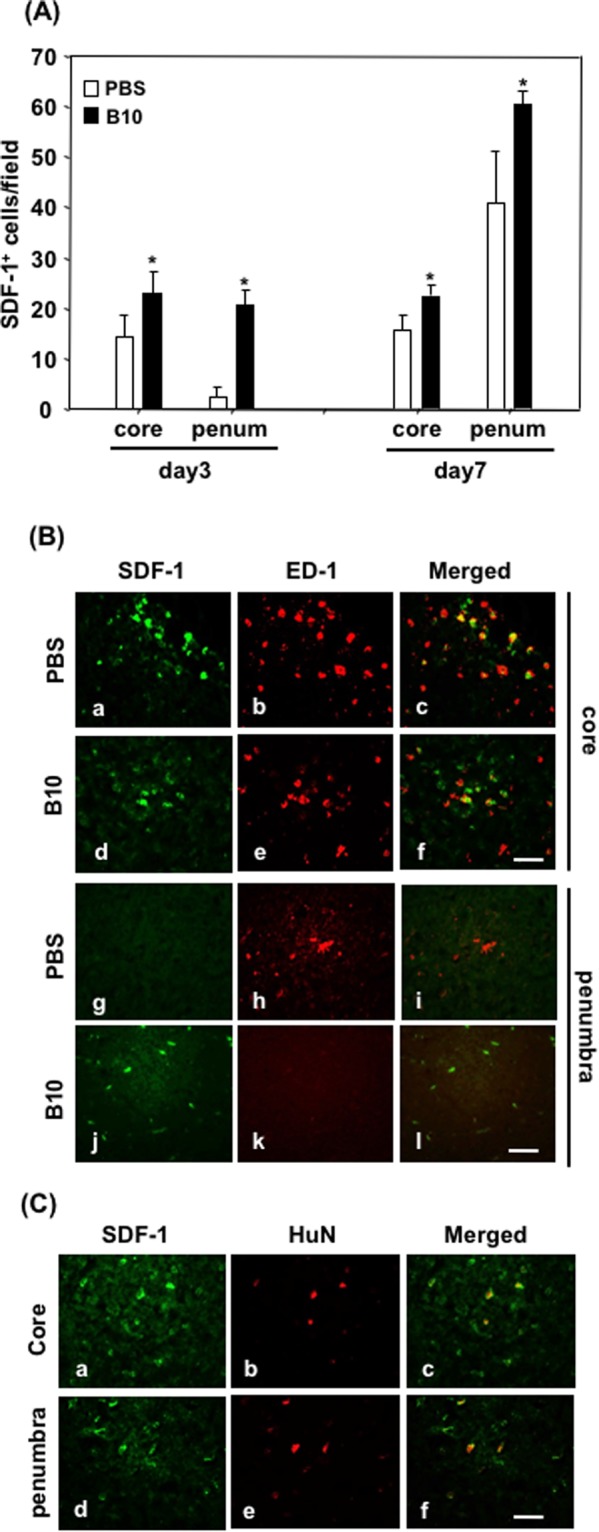
Quantification and identification of SDF-1 expressing cell types in rat brains after MCAO. (A) After immunofluorescence staining of SDF-1, positive cells were counted in 5 random field of designated areas at X400 magnification. Three tissue sections of 2 mm apart were used to count the cells, and the average was considered as positive cell number of that rat. The data presented here as average ± SD (n = 5), and the statistical significance was evaluated by one-way ANOVA followed by Student-Newman-Keuls Post hoc analysis. *p < 0.05. (B) To determine the localization, double immunofluorescence staining of SDF-1 and macrophage/microglia marker ED1 was done, as described in the Materials and Methods. Representative photomicrographs of SDF-1 (a,d,g and j) and ED-1 (b,e,h and k), and their merged picture (c,f,i and l) in the core (a–f) and penumbra (g–l) areas of PBS-control (a–c and g–i) and B10-transplanted (d–f and j–l) rats are shown. (B) To determine SDF-1 expression in transplanted B10 cells, double immunofluorescence staining of SDF-1 and human nuclei (to identify human origin B10 cells) was done in B10 transplanted rats 3 days after MCAO. Representative photomicrographs of SDF-1 (a and d), human nuclei (b and e) and their merged pictures (c and f) in the core (a–c) and penumbra (d–f) are shown. Scale bar = 50 μM.
