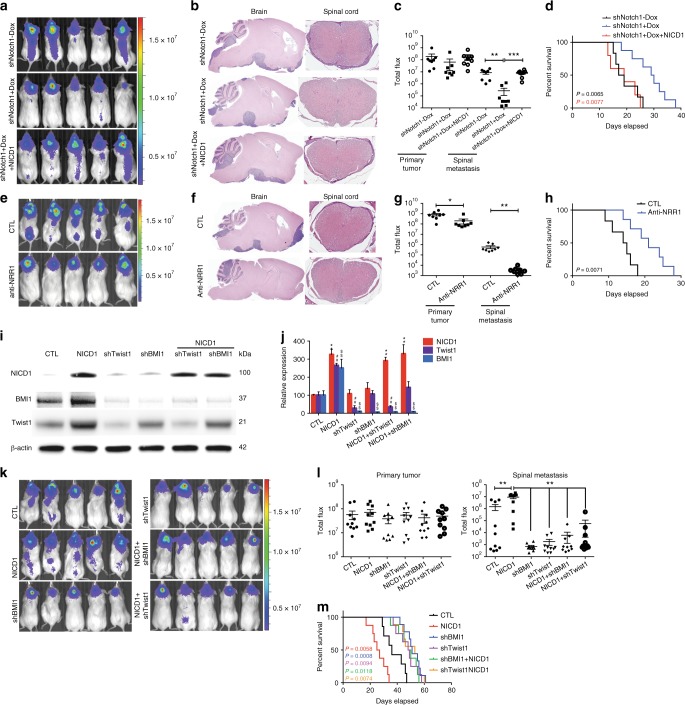
Fig. 2.
NOTCH1 signaling regulates Group 3 medulloblastoma metastasis. a–d shRNAs specific to NOTCH1 (shNotch1) were introduced through lentiviral infections into luciferase-expressing D425 cells. 2 μg mL−1 of Dox was used to induce the expression of shRNA (shNotch1 + Dox). The un-induced infected cells (shNotch1-Dox) were used as controls. Recovery of NOTCH1 expression was performed by overexpressing NICD1 in NOTCH1-silenced Group 3 medulloblastoma cells (shNotch1 + Dox + NICD1). Bioluminescence imaging (a), hematoxylin/eosin staining (b), and quantification of total flux (c) from primary tumors and spinal metastases in mice injected with infected cells. ** P < 0.01, Mann-Whitney U test. d Kaplan–Meyer survival curves of mice injected with Group 3 medulloblastoma cells down-expressing NOTCH1 (shNotch1 + Dox, blue), control (shNotch1-Dox, black), or with recovered NICD1 expression (shNotch1 + Dox + NICD1, red). P-value is from log-rank test. e Bioluminescence imaging of mice injected with luciferase-expressing D425 cells and intrathecally treated with anti-NRR1 or vehicle (CTL). Hematoxylin/eosin staining (f) and quantification of total flux (g) from primary tumors and spinal metastases. *P < 0.05, **P < 0.01, Mann-Whitney U test. h Kaplan–Meyer survival analysis of mice intrathecally treated with anti-NRR1 or vehicle (CTL). P value is from log-rank test. i Immunoblotting for NICD1, TWIST1 and BMI1 in D425 cells control (CTL); overexpressing NICD1 (NICD1); down-expressing Twist1 (shTwist1); down-expressing BMI1 (shBMI1), overexpressing NICD1 and down-expressing TWIST1 (NICD1 + shTwist1); and over-expressing NICD1 down-expressing BMI1 (NICD1 + shBMI1). kDa, Kilodaltons. β-actin was used as loading control. j Quantification of NICD1 (red), TWIST1 (purple) and BMI1 (blue) expression relative to β-actin from three independent experiments. **P < 0.01 versus NICD1 control; ##P < 0.01 versus Twist1 control; $$P < 0.01 versus BMI1 control, Mann-Whitney U test. Bioluminescence imaging (k), quantification of flux values (l), and survival curves (m) from mice injected with luciferase-expressing D425 cells over-expressing NICD1 (NICD1, red); control (CTL, black); down-expressing TWIST1 (shTwist1, purple); down-expressing BMI1 (shBMI1, blue); over-expressing NICD1 and down-expressing Twist1 (NICD1 + shTwist1, orange); over-expressing NICD1 and down-expressing BMI1 (NICD1 + shBMI1, green). Error bars, SD

