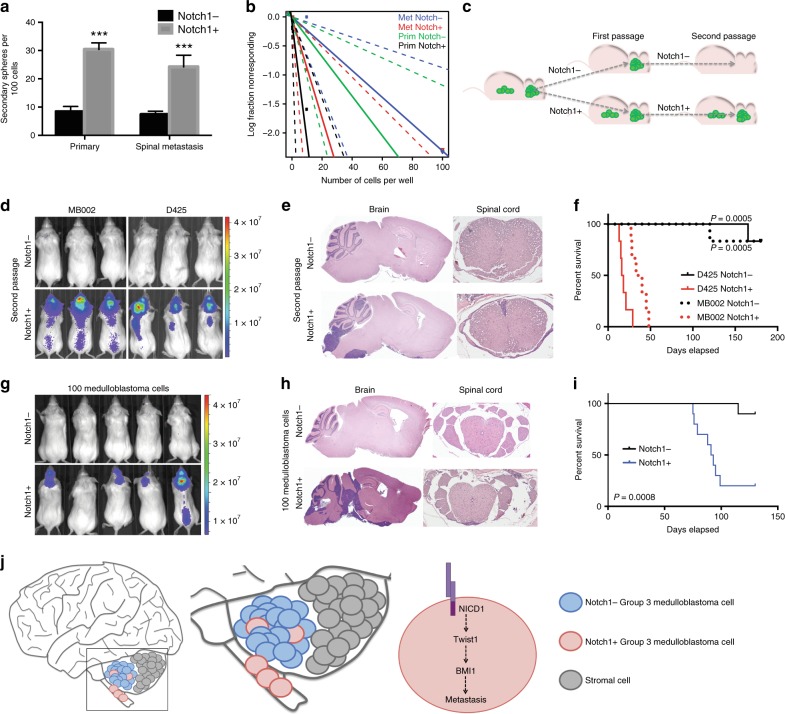
Fig. 3.
NOTCH1+ cells promote Group 3 medulloblastoma self-renewal. a In vitro extreme limiting dilution assays comparing the frequency of tumorsphere formation between NOTCH1− and NOTCH1+ Group 3 medulloblastoma cells isolated from primary tumors and spinal metastases. ***P < 0.001, Mann–Whitney U test. b Quantitative analysis of the frequency of colonies formed by NOTCH1− and NOTCH1+ Group 3 medulloblastoma cells isolated from primary tumors and spinal metastases. ELDA software (http://bioinf.wehi.edu.au/software/elda/) was used to calculate medulloblastoma stem cell frequency and assess statistical significance. Prim NOTCH1- (green) versus Prim NOTCH1+ (black) (P = 0.02) and Met NOTCH1− (blue) versus Met NOTCH1+ (red) (P = 0.04). c Scheme of NOTCH1− and NOTCH1+ in vivo sorting and passages. d Bioluminescence imaging and hematoxylin/eosin staining of brains and spines (e) from mice injected with the second in vivo passage of NOTCH1− or NOTCH1+ sorted from primary tumors generated by MB002 and D425. f Kaplan–Meyer survival curves of mice injected with the second in vivo passage of NOTCH1− and NOTCH1+ in two models (MB002 and D425). P-values are from log-rank test. Bioluminescent imaging (g), hematoxylin/eosin staining of brains and spines (h), and survival curves (i) from mice injected with 100 NOTCH1− or NOTCH1+ medulloblastoma cells (D425). j Proposed model: NOTCH1-induced medulloblastoma metastasis occurs trough the activation of the NICD1-TWIST1-BMI1 axis. Error bars, SD

