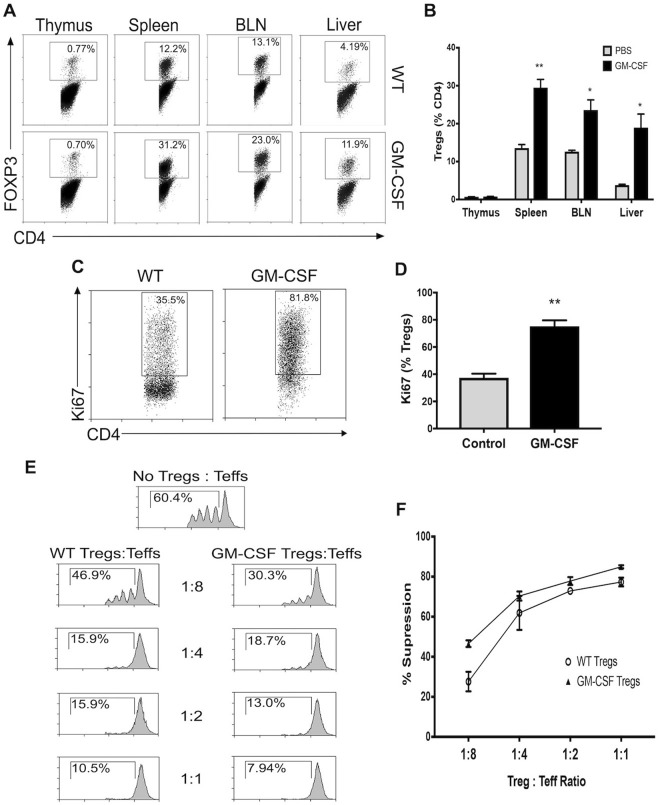
Figure 3.
GM-CSF administration increases functionally suppressive Tregs in peripheral lymphoid organs. GM-CSF was administered to C57BL/6 mice daily for 4 days (n = 3). (A) Representative dot plots of percent Tregs within various tissues of untreated and GM-CSF treated mice. (B) Bar graphs showing the percent Foxp3+ Tregs in indicated tissues from untreated and GM-CSF treated mice. Values are expressed as means ± SEM (n = 3; *p < 0.05, **p < 0.01). (C) Representative dot plot of percent Tregs with Ki67 expression from the spleen of untreated and GM-CSF treated mice. (D) Summary bar graphs for data shown in C Values are expressed as means ± SEM (n = 3; **p < 0.01). (E) Treg suppression analysis was performed on Tregs isolated from the spleens of untreated and GM-CSF mice. Representative histograms are shown. (F) Percent suppression was determined at each ratio of Tregs/Teff. Values are expressed as means ± SEM (n = 3; n.s. = not significant).

