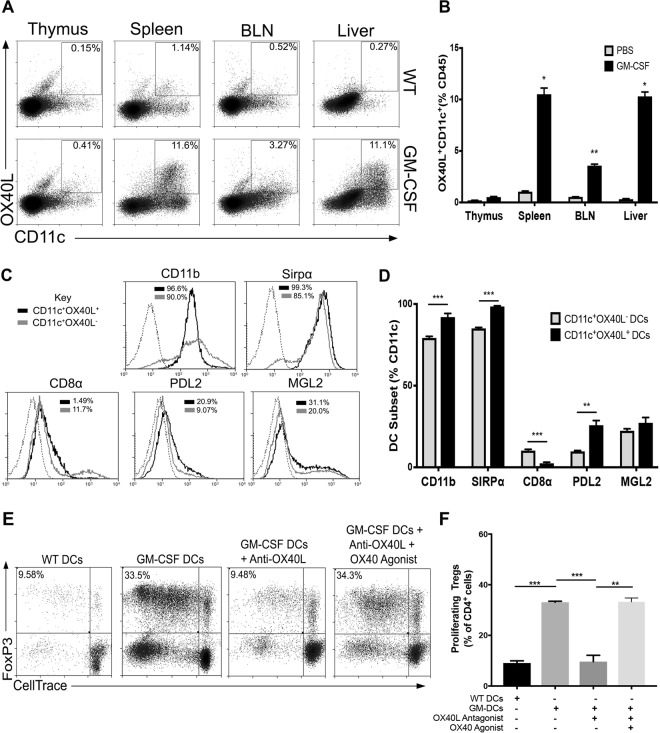
Figure 4.
In vivo derived DCs expand Tregs through OX40L. (A) Representative dot plots of OX40L+CD11c+ expression within various tissues of untreated and GM-CSF treated mice (n = 3). (B) Bar graphs show percent OX40L+CD11c+ DCs in indicated tissues. Values are expressed as means ± SEM (n = 3; *p < 0.05, **p < 0.01). (C) Representative histograms of indicated markers on OX40L+CD11c+ (black) compared to OX40L+CD11c− (grey) isolated cells. Dotted lines represent stained controls. (D) Bar graphs showing the expression of indicated markers on OX40L+CD11c+ DCs and OX40L−CD11c+ DCs. Values are expressed as means ± SEM (n = 3; **p < 0.01, ***p < 0.001). (E) CD11c+ DCs were isolated from the spleens of GM-CSF treated or WT mice and co-cultured with CD4 T-cells with or without OX40L blockade and/or supplemented with OX40 agonist. Representative dot plots are shown. (F) Summary bar graphs showing percent proliferating Foxp3+ Tregs in indicated co-cultures. Values are expressed as means ± SEM (n = 3; **p < 0.01, ***p < 0.001).

