
Figure 2.
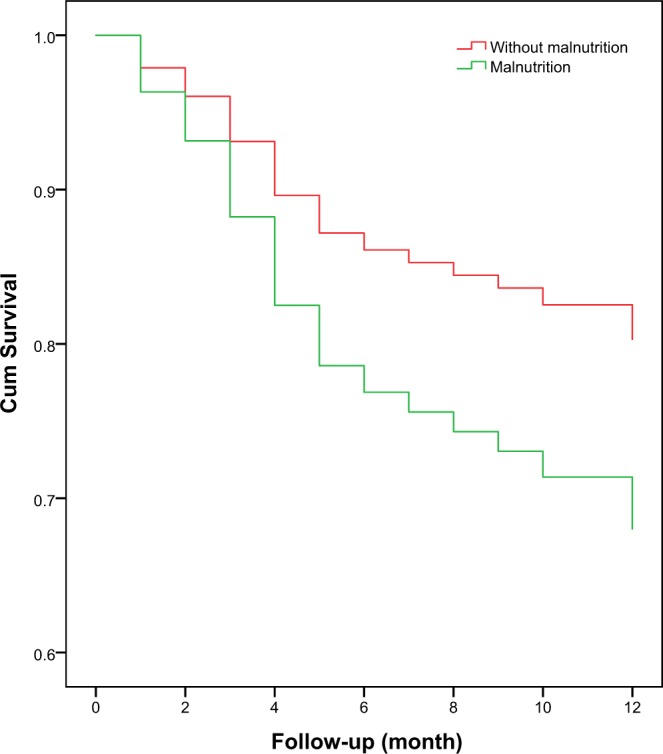
Survival curves of the study population according to nutrition status at baseline. Survival curves significantly differed in the log-rank test (p = 0.018).
Official websites use .gov
A
.gov website belongs to an official
government organization in the United States.
Secure .gov websites use HTTPS
A lock (
) or https:// means you've safely
connected to the .gov website. Share sensitive
information only on official, secure websites.
Survival curves of the study population according to nutrition status at baseline. Survival curves significantly differed in the log-rank test (p = 0.018).