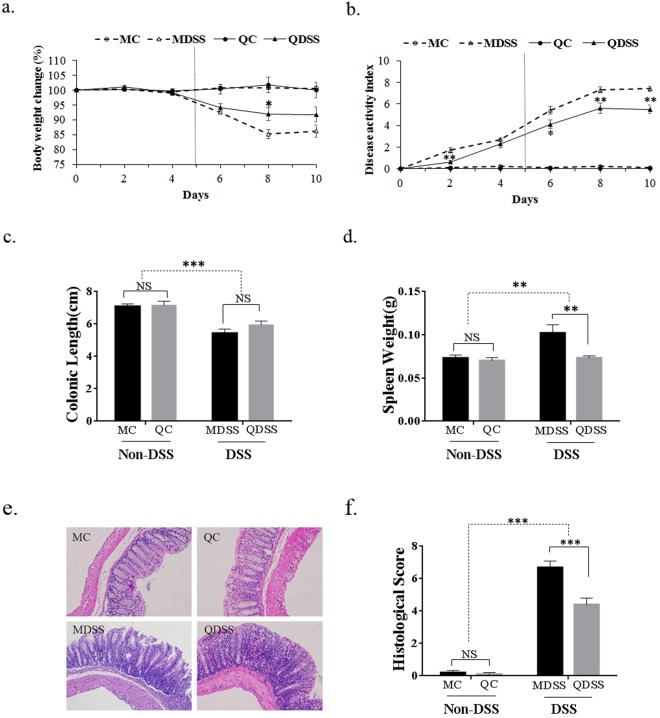
Figure 1.
Body physiology and pathological indices: (a) relative body weight changes and (b) disease activity index (DAI) scores monitored every two days over the 10 days (MDSS and QDSS mice was treated with 5 days DSS exposure in drinking water and followed by another 5 days tap water); (c) colon lengths, (d) spleen weights, (e) histological analysis and (f) histological severity scores of the different treatment mice. Comparisons of various anatomical measurements among four groups were made by two-way analysis of variance (ANOVA), followed by Fisher’s LSD post hoc tests. *Indicates significant difference with P < 0.05, **Indicates P < 0.01 and ***Indicates P < 0.001; NS indicates lack of statistically significant difference. In (a) and (b) the statistically differences were only marked within the DSS-treated or Non-DSS control groups (MC vs. QC; MDSS vs. QDSS).

