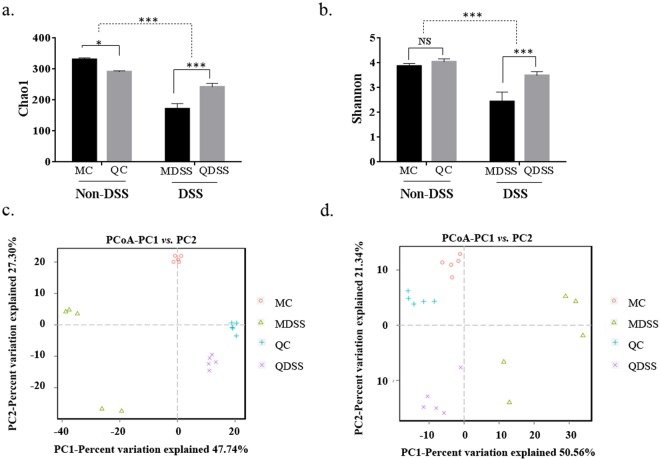
Figure 2.
Microbiota diversity indices of the different groups: (a) the bacterial richness of microbiota communities estimated by the Chao1 value. (b) The bacterial diversity of the microbiota communities estimated by Shannon index; (c) PCoA plot of unweighted UniFrac distance values and (d) weighted UniFrac distance values. All groups of α diversity indices (Chao1 and Shannon) were analyzed by two-way analysis of variance (ANOVA) followed Fisher’s LSD post hoc tests. *Indicates significant difference with P < 0.05, **Indicates P < 0.01 and ***Indicates P < 0.001; NS indicates lack of statistically significant difference.

