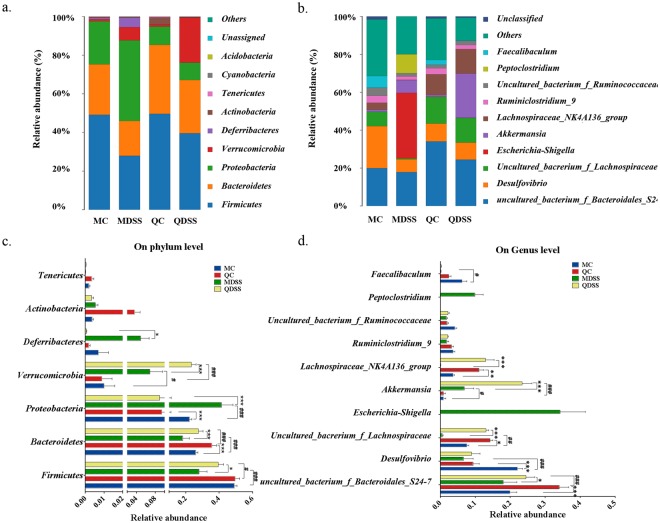
Figure 3.
Compositions of microbiota in mice cecum on (a) phylum level and (b) genus level in all experimental groups and comparisons of relative abundance (percentage of sequences) of the (c) main bacterial phyla and (d) main bacterial genera. Calculation was based on average relative abundance of main bacterial communities. In (c) and (d), asterisk indicates difference within same treatment (MC vs. QC, MDSS vs. QDSS), *Indicates significant difference with P < 0.05, **Indicates P < 0.01 and ***Indicates P < 0.001; #Represents a significant difference between same diet with different treatment (MC vs. MDSS, QC vs. QDSS), #Indicates significant difference with P < 0.05, ##Indicates P < 0.01 and ###Indicates P < 0.001. NS indicates lack of statistically significant difference.

