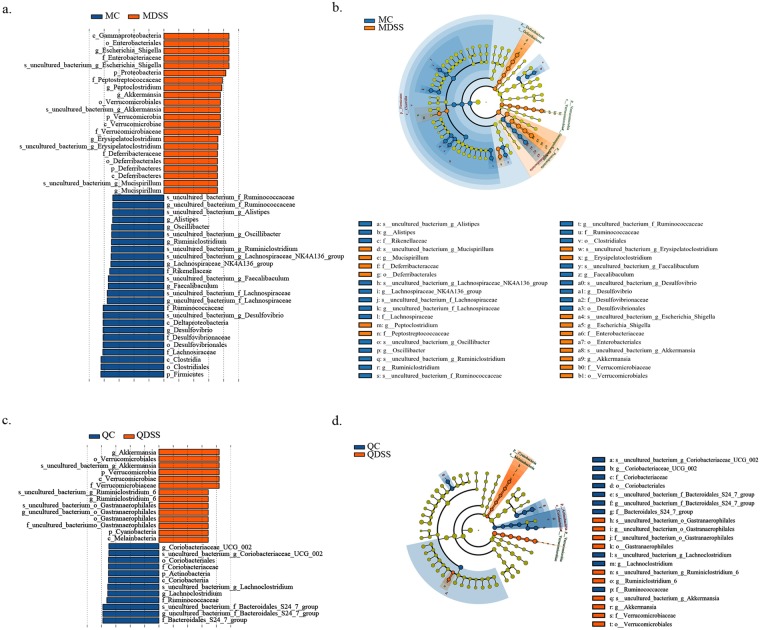
Figure 5.
LEfSE was used to identify the representative taxa in different groups. Output showing effect size of significantly enriched taxa in each group when perform comparison between (a) MC and MDSS; (c) QC and QDSS. Taxonomic cladogram obtained using LEfSe analysis of the 16S sequences from (b) MC vs. MDSS and (d) QC vs. QDSS. The differential abundant taxa are presented with designated colors using LEfSe method, Schemes follow the same formatting. The taxa from are colored in blue and orange, respectively. The taxa with nonsignificant changes between the non-DSS and DSS treated mice are colored in yellow. Each small circle’s diameter represents the taxon abundance.

