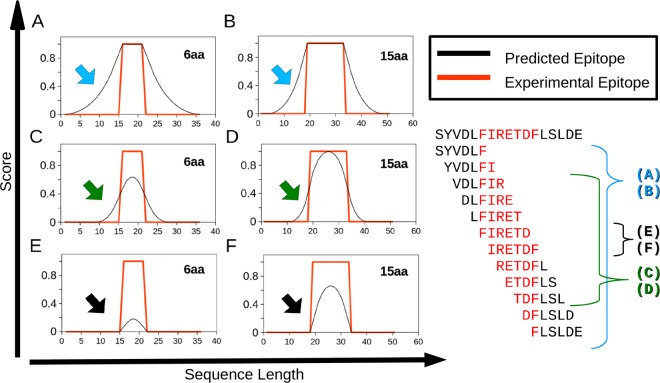
Figure 1.
Selection of Kmers as epitopes. The graphs illustrate how the selection of positive Kmers to be considered epitopes alters the rate of false positives based on compositional rules. As an example, Kmers of 6 and 15 aa were employed. The X-axis shows the amino acid sequence position. The Y-axis shows the probability of an amino acid residue to be a part of an epitope. Red lines represent a true epitope. Black lines represent computational prediction. (A) and (B) illustrate a prediction where at least one amino acid residue must be predicted as an epitope to label a Kmer as positive (C) and (D) show that when 50% of the amino acids must be predicted as an epitope to label a Kmer as positive (E) and (F) shows when all the amino acid residues from of a Kmer must be predicted as an epitope to label a Kmer as positive. The arrows indicate the portion of potentially false positives in each prediction method. On the right side of the figure, there is an example of prediction of an epitope marked red within the sequence SYVDLFIRETDFLSLDE by means of a 6 aa Kmer and the three approaches illustrated in the graphs.

