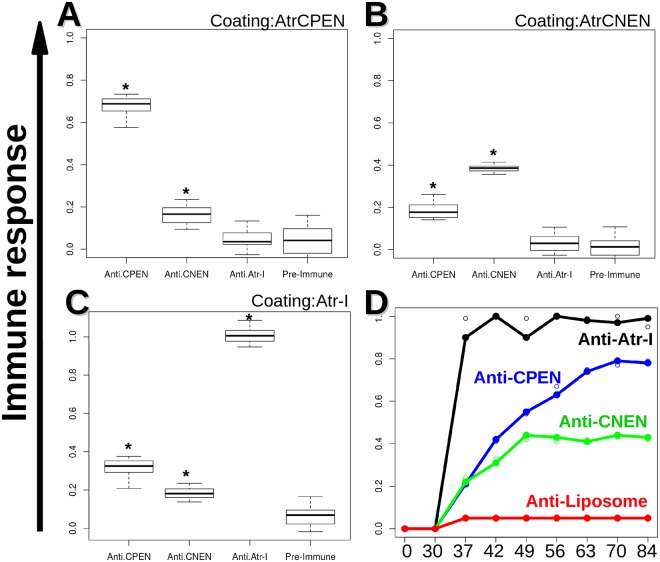
Figure 3.
ELISA tests of anti-CPEN, CNEN, and Atr-I sera. (A–C) show the boxplots results for ELISA plates coated individually by CPEN, CNEN, and Atr-I, respectively. |Plates were incubated for 1 h with the respective sera at 37 °C followed by another round of 3× washing before incubation with a respective secondary antibody for 1 h. An OPD substrate was added for ~20 minute incubation, and the reaction was stopped with H2SO4 prior plate reading. The black lines within the boxes correspond to medians. All the samples marked with (*) show to be significantly different for a p < 0.05, when comparing by the t test available in software R. (D) shows antibody binding over 9 doses (x-axis represents days).

