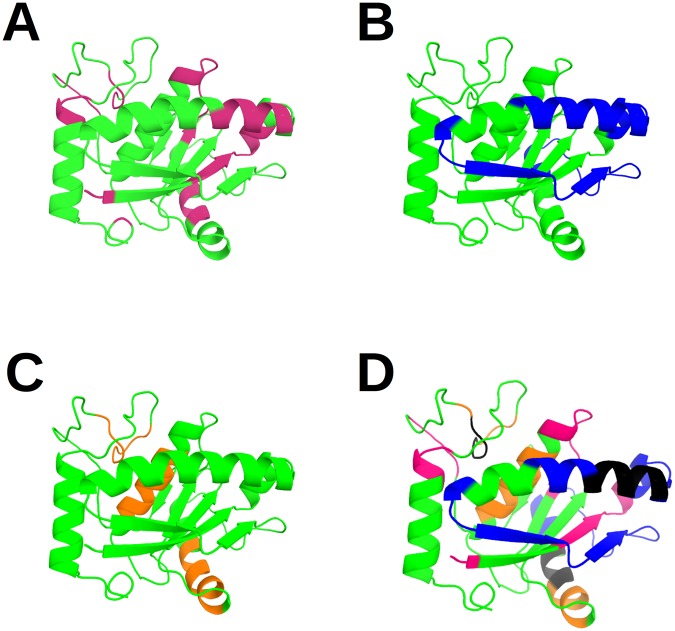
Figure 5.
Localization of predicted epitopes in the Atr-I model. A cartoon view of the structural model of the protein Atr-I is displayed. The residues that belong to the computational prediction are shown in pink (A) while the experimental epitopes and the cross-reactive regions between the different serum samples tested are indicated in blue (anti-Atr1) and orange respectively (anti-Bap1 and anti-Leuc-a) (B,C). The overlap of these methods is presented in (D) where the black regions correspond to the matching computational and experimental predictions.

