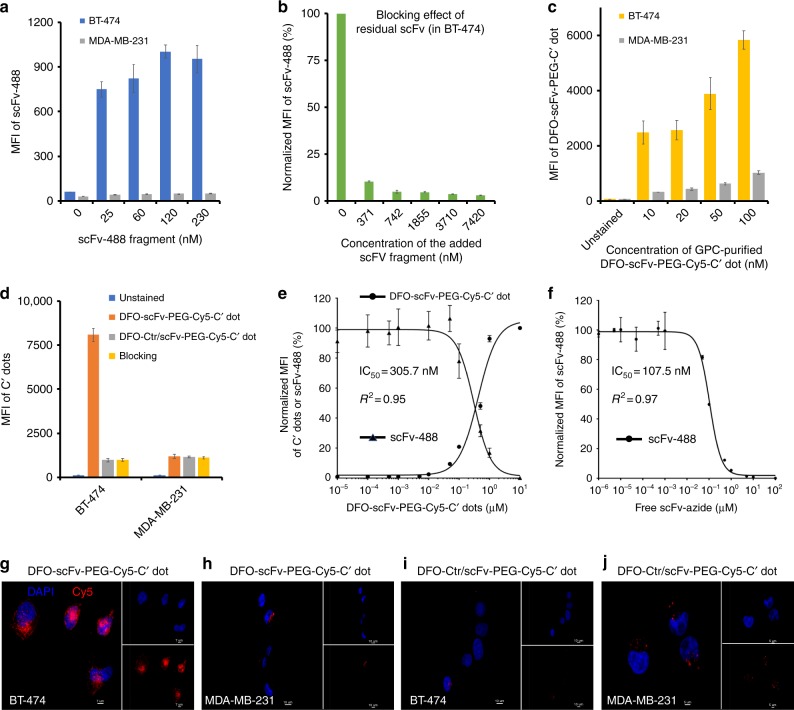
Fig. 2.
In vitro HER2-specific targeting and half maximal concentrations (IC50) of free scFv and DFO-scFv-PEG-Cy5-C’ dots using flow cytometry. a In vitro concentration-dependent HER2 targeting of scFv-488 in BT-474 and MDA-MB-231 cell lines. b Blocking of scFv-488 binding to HER2 receptors expressed on BT-474 cells as a function of scFv-azide concentration. c HER2-targeted uptake of GPC-purified DFO-scFv-PEG-Cy5-C’ dots in BT-474 and MDA-MB-231 cells as a function of particle concentration. All p values < 0.001. d HER2 targeting specificity of DFO-scFv-PEG-Cy5-C’ dots (100 nM). DFO-Ctr/scFv-PEG-Cy5-C’ dots (100 nM) were used as a particle control. For the blocking group, a 20-fold excess of free scFv-azide fragment was used. All p values < 0.001. e Concentration-dependent inhibition of scFv-488 binding to BT-474 cells by DFO-scFv-PEG-Cy5-C’ dots. IC50 = 305.7 nM. f Concentration-dependent inhibition of scFv-488 binding to BT-474 cells by free scFv-azide fragments. IC50 = 107.5 nM. Each data point represents the mean ± s.d. of three replicates. Confocal microscopy imaging of DFO-scFv-PEG-Cy5-C’ dots (100 nM) in g BT-474 (scale bar: 7 μm) and h MDA-MB-231 (scale bar: 10 μm), and DFO-Ctr/scFv-PEG-Cy5-C’ dots (100 nM) in i BT-474 (scale bar: 10 μm) and j MDA-MB-231 (scale bar: 5 μm). Blue and red colors represent DAPI and Cy5, respectively. Insets in g–j show the corresponding DAPI and Cy5 channels

