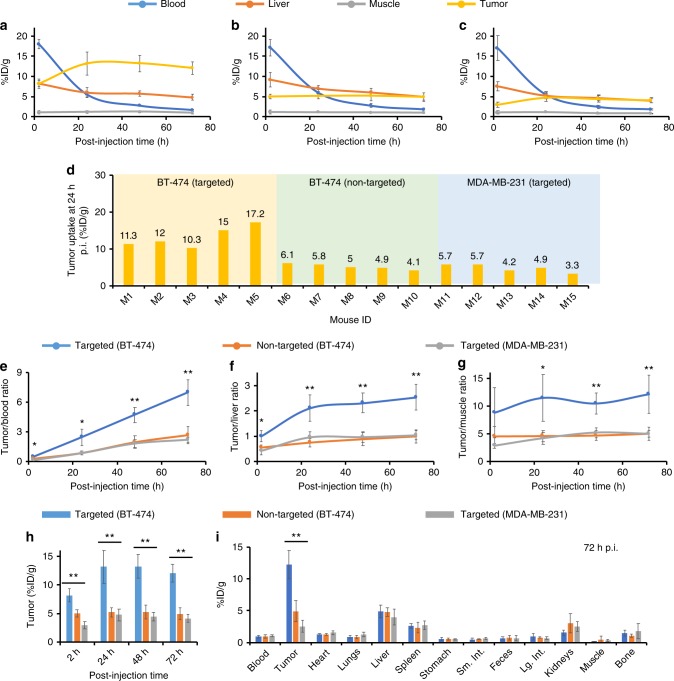
Fig. 4.
Region-of-interest quantification and biodistribution studies. Time–activity curves showing major organ uptake of 89Zr-labeled nanoparticles in mice injected with a targeted group: 89Zr-DFO-scFv-PEG-Cy5-C’ dots, BT-474 tumor, b non-targeted group: 89Zr-DFO-Ctr/scFv-PEG-Cy5-C’ dots, BT-474 tumor, and c targeted group: 89Zr-DFO-scFv-PEG-Cy5-C’ dots, MDA-MB-231 tumor. d Variation of tumor uptake (%ID g−1) for 3 cohorts of mice. M1–M5: BT-474 tumor-bearing mice injected with 89Zr-DFO-scFv-PEG-Cy5-C’ dots (targeted); M6–M10: BT-474 tumor-bearing mice injected with 89Zr-DFO-Ctr/scFv-PEG-Cy5-C’ dots (non-targeted); M10–M15: MDA-MB-231 tumor-bearing mice injected with 89Zr-DFO-scFv-PEG-Cy5-C’ dots (targeted). Comparisons of e tumor-to-blood ratios, f tumor-to-liver ratios, g tumor-to-muscle ratios, and h tumor uptake among three groups. N = 5 animals per group. i Biodistribution profiles for all animal group at 72 h p.i. *p < 0.01, **p < 0.001. The two degrees-of-freedom F-test was followed by pairwise t-tests that were adjusted for multiple comparisons using the Holm method. Each data point represents the mean ± s.d. of five replicates

