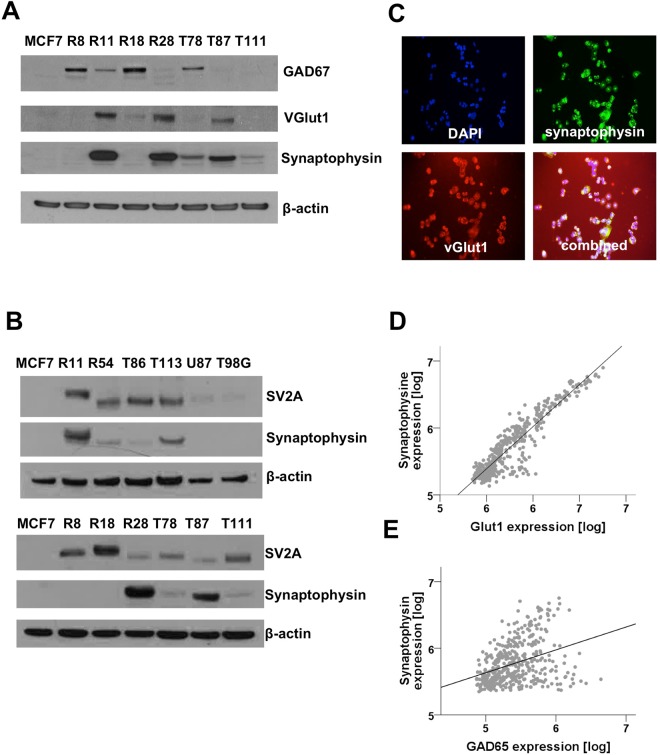
Figure 5.
Glutamatergic and GABAergic glioma cells. (A,B) Westernblot of GSC lines and control samples (breast cancer cell line MCF7, classical glioma cell lines T98G, U87). Blots were probed with antibodies against GAD67, synaptophysin, SV2A and vGlut1. Actin was used as loading control. (C) Immunocytochemistry against vGlut1 and synaptophysin. DAPI was used to label the nuclei. (D,E) Correlation of synaptophysin expression with vGlut1 (Pearson r = 0.92, p < 0.001) and GAD67 (Pearson r = 0.36, p = 0.001) using mRNA expression data from the RemBranDT database (accessed: 09 January 2018).

