Fig. 3.
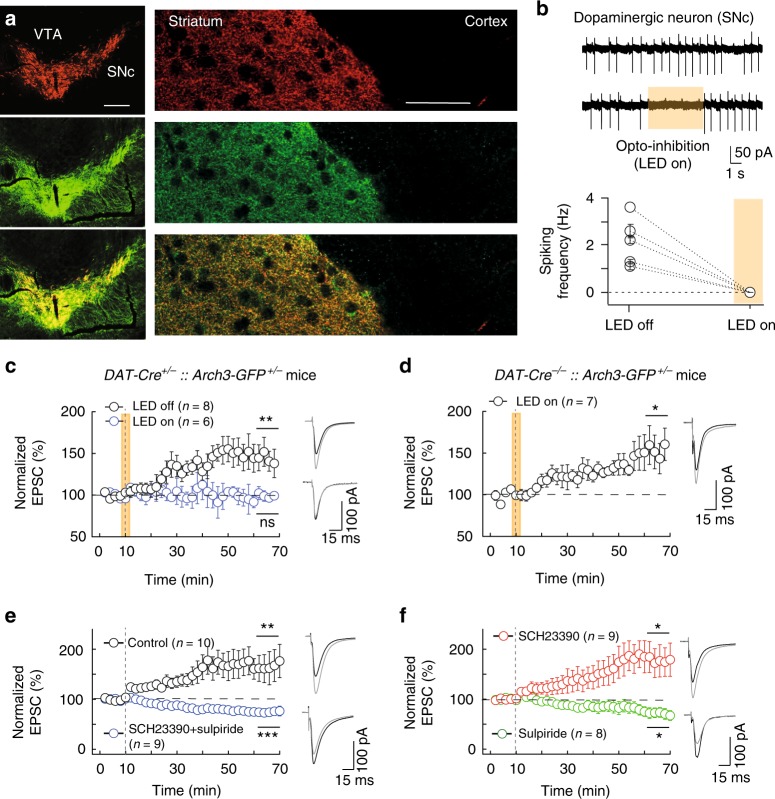
eCB-LTP requires dopamine release during pairings and is D2R-dependent. a–d Induction of eCB-LTP requires dopamine release during the STDP paired-activity paradigm. a Double immunostaining for tyrosine hydroxylase (indicating dopaminergic cell bodies in SNc and dopaminergic afferences in striatum; upper panels) and GFP (indicating Arch3-expression; middle panels) in SNc (left panels) and in striatum (right panels); merge images are shown in the lower panels. Scale bars: 500 µm (SNc) and 50 µm (striatum). b Spontaneous firing of dopaminergic neurons recorded in cell-attached mode in DAT-Cre+/−::Arch3-GFP+/− mice with and without light (upper traces). Summary graph showing all experiments performed in DAT-Cre+/−::Arch3-GFP+/− mice with and without opto-inhibition. c 15 post-pre pairings induced tLTP (n = 8, 6/8 cells showed tLTP) in DAT-Cre+/−::Arch3-GFP+/− mice without opto-stimulation (LED off), while opto-stimulation (LED on) during STDP pairings prevents tLTP induction (n = 6, 1/6 cells showed tLTP). This illustrates that eCB-tLTP requires DA release during STDP pairings. d 15 post-pre pairings induced tLTP with concomitant opto-stimulation (16 s duration) during STDP protocol in DAT-Cre−/−::Arch3+/+ mice (n = 7, 6/7 cells showed tLTP). In panels (b–d), the yellow areas illustrate when LED was on to promote an opto-inhibition. e, f 10 post-pre pairings (−30 < ∆tSTDP < 0 ms) induced tLTP is D2R-activation dependent. Summary of STDP experiments showing that eCB-tLTP induced with 10 post-pre pairings (n = 10) is prevented by the co-application of antagonists of D1R and D2R, SCH23390 (4 µM) and sulpiride (10 µM) (n = 9, 8/9 cells showed tLTD and 1/9 showed no plasticity) (e), and with the D2R antagonist, sulpiride (10 µM, n = 8, 0/8 cells showed tLTP and 5/8 showed tLTD) but tLTP was left unaffected by the sole application of the D1R antagonist, SCH23390 (4 µM, n = 9, 8/9 cells showed tLTP) (f). Representative traces are the average of 15 EPSCs during baseline (black traces) and 45 min after STDP protocol (grey traces). Vertical grey dashed line indicates the STDP protocol. Error bars represent sem. *p < 0.05; **p < 0.01; ***p < 0.001; ns: not significant by one sample t-test (c–f)

