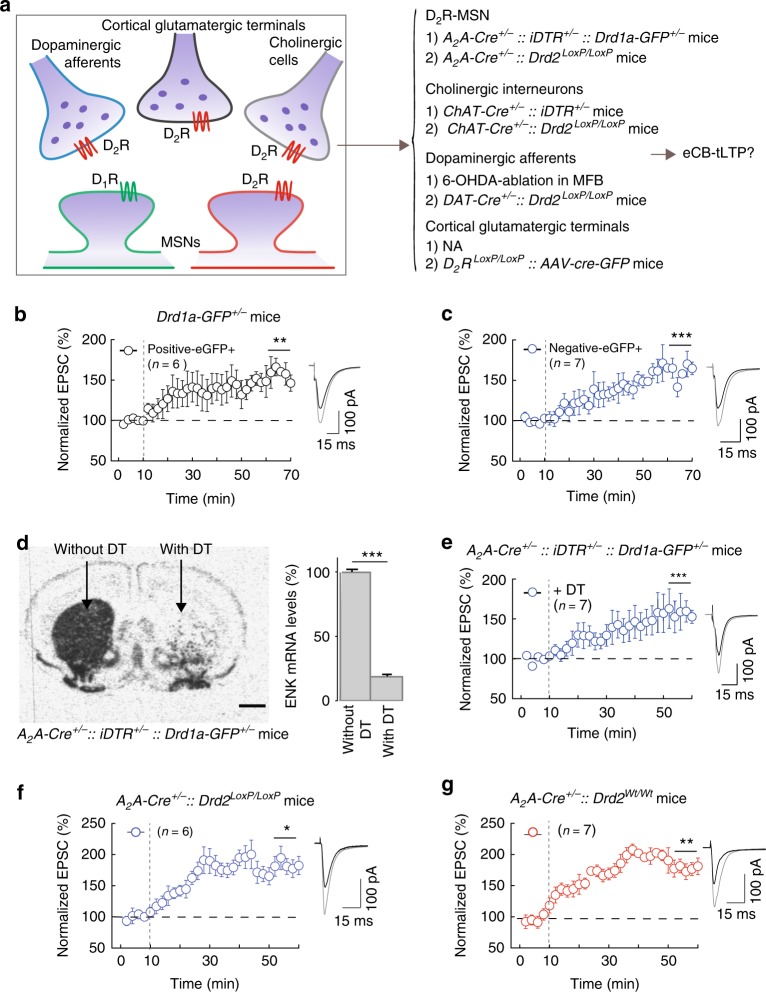
Fig. 4.
eCB-tLTP does not depend on D2R expressed by D2R-MSNs. a Location of D2R in striatum expressed in striato-pallidal MSNs, cholinergic interneurons, SNc dopaminergic and cortical glutamatergic afferents. Right: the two complementary strategies to identify the D2R involved in eCB-tLTP: (1) genetic-ablation of D2R-MSN or cholinergic interneurons (using DTR and stereotaxic DT injection) and 6-ODHA-ablation of dopaminergic cells in the MFB, and (2) D2R-cKO in D2R-MSN, cholinergic interneurons, dopaminergic cells, or corticostriatal glutamatergic afferents; NA accounts for the impossibility to use a genetic-ablation of corticostriatal afferents without losing the studied EPSCs. b, c tLTP induced with 15 post-pre pairings is observed in both striato-nigral (D1R-eGFP positive neurons, D1R-eGFP+, n = 6, 5/6 cells showed tLTP) (b) and striato-pallidal (D1R-eGFP negative neurons, non-D1R-eGFP+, n = 7, 7/7 cells showed tLTP) (c) MSNs. d, e Experiments of plasticity expression in genetically-ablated mice for A2A-expressing neurons in the dorsal striatum. d In situ hybridization autoradiograms (left) and quantification (right bar graph, n = 5 mice) of enkephalin mRNA in striatum caudal level of coronal sections in A2A-Cre+/−::iDTR+/−::Drd1a-GFP+/− mice injected with DT stereotaxically in the dorsal striatum (right hemisphere) and without DT injection (left hemisphere). Scale bars: 1000 µm. e In mice in which D2R-MSNs were ablated (A2A-Cre+/−::iDTR+/−::Drd1a-GFP+/− mice injected with DT stereotaxically in the dorsal striatum) tLTP was induced with 15 post-pre pairings (n = 7, 7/7 cells showed tLTP). f, g Experiments of plasticity expression in selective cKO for D2R expressed by striatal D2R-MSNs. f In mice in which D2R was specifically knocked-out in D2R-MSNs (A2A-Cre+/−::Drd2LoxP/LoxP mice) tLTP was induced with 15 post-pre pairings (n = 6, 5/6 cells showed tLTP). g tLTP was observed in mice serving as the Cre driver control (A2A-Cre+/−::Drd2Wt/Wt mice, n = 7, 6/7 cells showed tLTP). Representative traces are the average of 15 EPSCs during baseline (black traces) and 45 min after STDP protocol (grey traces). Vertical grey dashed line indicates the STDP protocol. Error bars represent sem. *p < 0.05; **p < 0.01; ***p < 0.001 by one sample t-test (b, c–g) or Wilcoxon Signed rank test (b)

