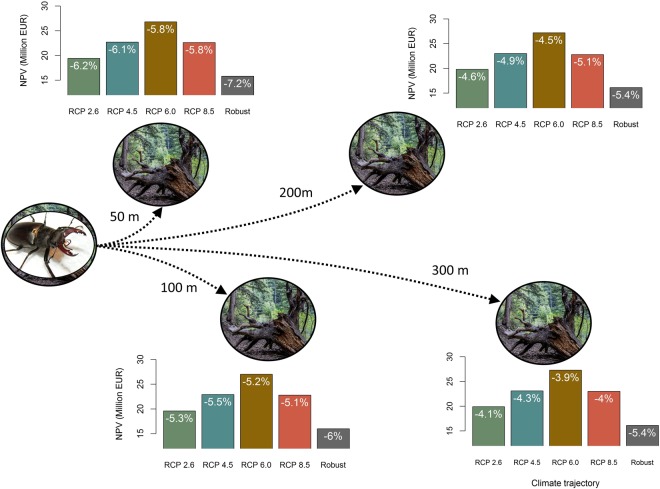
Figure 4.
The figure shows the forest profitability for all four dispersal capacities considered (50, 100, 200 and 300 m), for each climate trajectory considering the deterministic case and the expected net present value (NPV) for the robust case, taking into account all climate trajectories, economic and disturbance uncertainty. Moreover, the relative NPV reduction compared to the baseline scenario, without the creation of the habitat network, is displayed inside the corresponding bar. For the robust case, the reduction corresponds to the loss in the Value-at-Risk. (Sources: https://pixabay.com/pt/vida-selvagem-animais-insetos-87168/; https://pixabay.com/pt/%C3%A1rvore-ra%C3%ADzes-ver%C3%A3o-1391055/). The figure was created using paint.net version 4.0.12 (https://www.getpaint.net/).

