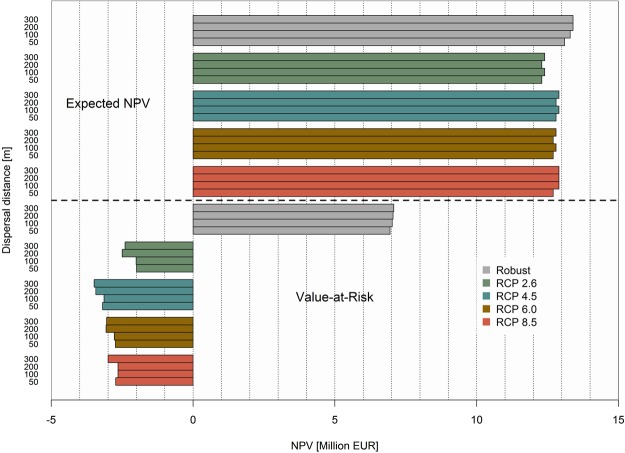
Figure 5.
Performance of the robust and deterministic solutions taking into account multiple sources of uncertainty (climate development, economic development and forest disturbances) and dispersal capacities. The upper half of the figure shows the expected Net Present Value (NPV) of the solutions and the lower half displays the Value-at-Risk of the same solutions. The figure was created using RStudio 1.1.456 (https://www.rstudio.com/).

