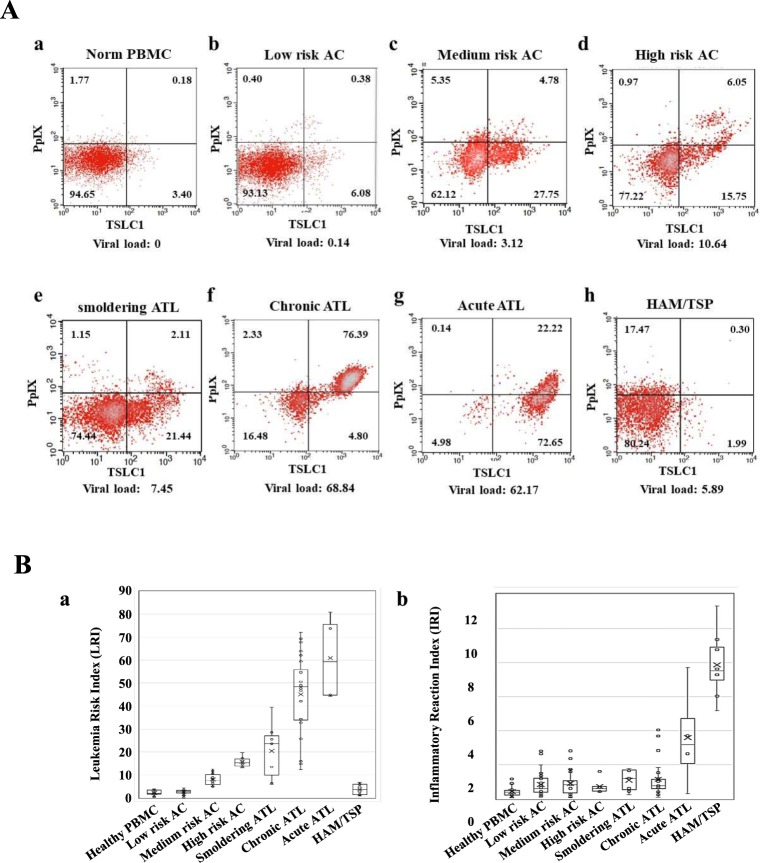
Figure 3.
(A) Flow cytometry (FCM) profiles reflecting the changes in the PpIX/TSLC1 parameters during the onset and progression of ATL and HAM/TSP. Gradual changes in the PpIX/TSLC1 profiles, shifting from PpIX(−)/TSLC1(−) in (a) healthy PBMCs to (e–g) PpIX(−)/TSLC1(+) and PpIX(+)/TSLC1(+) in relation to the onset and/or progression from smoldering-, to chronic-, to acute-ATL. (b–d) AC PBMCs showing intermediate profiles. (h) HAM/TSP showing an increase in PpIX(+)dim/TSLC1(−) fractions when compared to those in healthy PBMCs in addition to the PpIX(−)/TSLC1(−) fraction. (B) Leukemia Risk Index (LRI) and Inflammatory Reaction Index (IRI) changes during the onset and progression of ATL and HAM/TSP. LRI and IRI are defined as in Table 1. (a) Onset and progression-dependent increase of LRI as observed in ATL. The HAM/TSP specimen showed almost the same LRI value as healthy PBMCs. AC PBMCs were classified to 3 categories (low-, medium-, and high-risk) according to the LRI value, which corresponded to the typical FCM profiles in (A). (b) HAM/TSP showing high IRI values when compared to the other categories.

