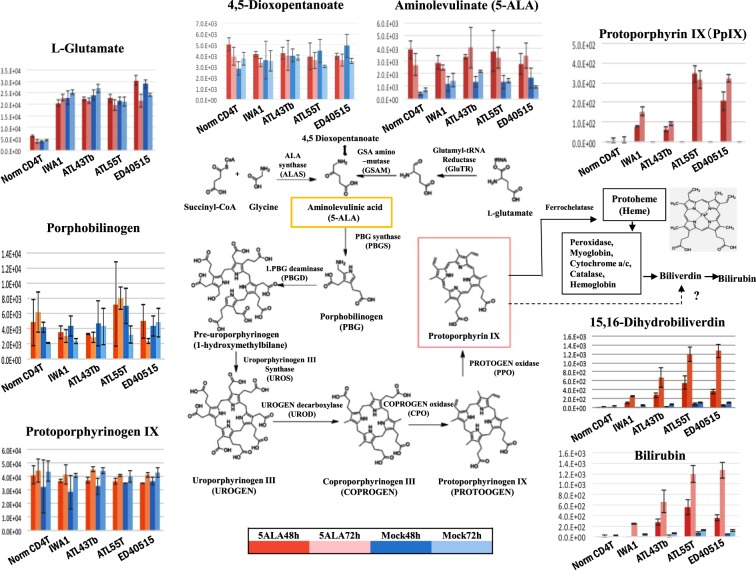
Figure 7.
Metabolomics analyses of the porphyrin/heme synthetic pathway. Metabolomics analyses of the porphyrin/heme synthetic pathway in normal CD4(+) T cells, HTLV-1-immortalized cell line (IWA-1), and ATL leukemic cell lines (ATL43Tb, ATL-55T, and ED40515(−)) after incubation with (red bar) or without (blue bar) 1 mM ALA for 48 (thick bar) or 72 h (faint bar). Metabolites in the porphyrin/heme pathway, from ALA to protoporphyrinogen IX, did not show significant differences in the normal CD4(+) T cells, HTLV-1-immortalized cell line, and ATL leukemic cell lines. However, PpIX showed a striking increase from almost base-line in normal CD4(+) T cells to more than 10–100-fold in immortalized cells and ATL leukemic cells in the presence of 1 mM ALA for 48 or 72 h, respectively. An increase in the downstream metabolites, biliverdin and bilirubin, was also observed. 5-ALA was indicated in yellow box and PpIX was in red box. Bars indicate standard deviation (SD) of triplicate experiments.

