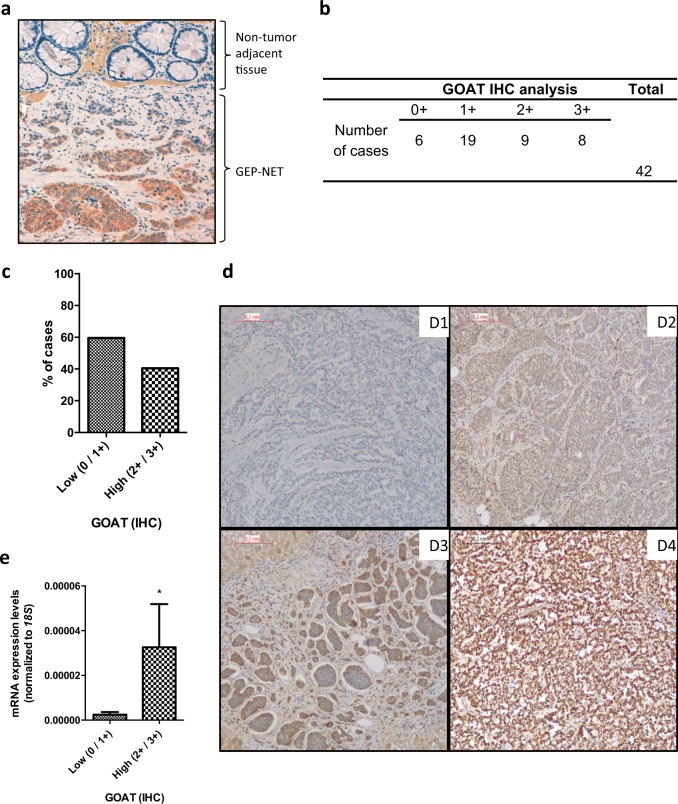
Fig. 2. Immunohistochemical analysis of GOAT enzyme in adjacent non-tumor tissue and GEP-NETs.
The presence of GOAT by immunohistochemistry using a specific antibody was determined in a subset of samples, which included tumor and non-tumor regions from patients diagnosed with GEP-NETs. a Representative images of the IHC analysis of GOAT enzyme in a GEP-NET sample compared with the non-tumor adjacent tissue. b Absolute number of cases according to the intensity of GOAT IHC staining (0, 1 + , 2 + , 3 + ). c The graph indicates the percentage of tumor samples according to the intensity of GOAT expression by IHC, 0 and 1 + have been grouped as low expression while 2 + and 3 + have been grouped as high intensity by IHC. d Representative images of different GOAT staining in GEP-NETs. In the analysis, 0, 1 + , 2 + , 3 + stand for absent, low, moderate, and high intensities of the tumor region staining compared to the adjacent region with non-tumor tissue (3D1, 3D2, 3D3, 3D4, respectively). This analysis revealed that GOAT was present in the vast majority of tumor cells compared with non-tumor adjacent tissue, with different grades of staining. e Correlation between the absolute mRNA expression of GOAT determined by qPCR in GEP-NETs samples (values are adjusted by 18S expression) and the intensity of GOAT staining

