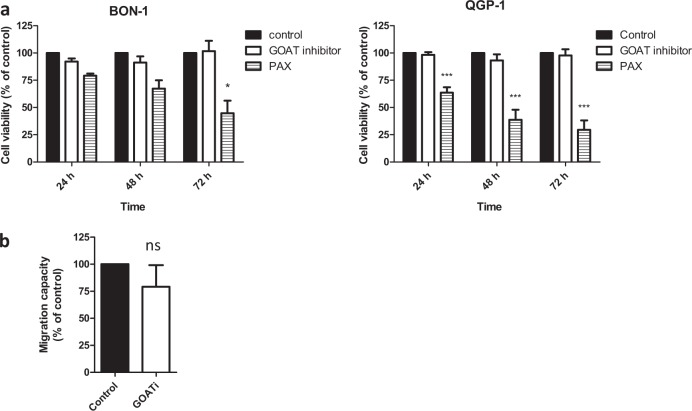
Fig. 4. In vitro analysis of the consequences of GOAT inhibitor (GOATi) treatment in NET cell lines.
a Cell proliferation rate in BON-1 and QGP-1 cell lines after 24, 48, and 72 h of GOATi treatment determined by Alamar-blue assay. Paclitaxel (PAX) was used as inhibitory control in proliferation assays. b Cell migration rate in BON-1 after 24 h of treatment with GOAT inhibitor by wound-healing assay. Cell proliferation rate compared to control was assessed by multiple comparison tests while migration was assessed by U-Mann–Whitney test. Values represent the mean ± SEM of at least three individual experiments. Asterisks indicate significant differences (*p < 0.05; ***p < 0.001) compared with control (set at a 100%). Legend: ns means non-significant

