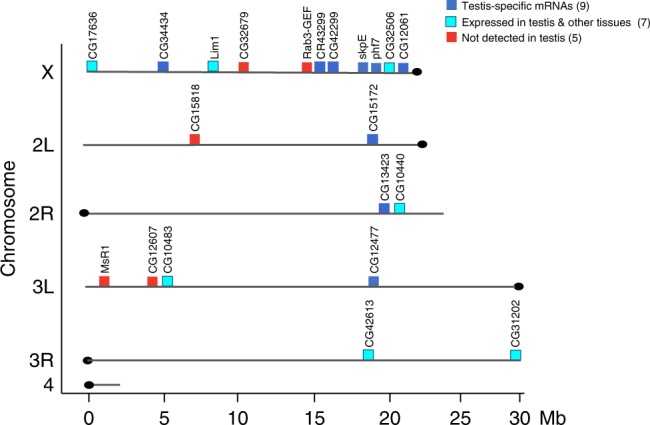
Fig. 5.

Distribution of the 21 SETDB1/H3K9me3 regulated genes in the genome. The 21 genes are not clustered together in the genome. Gene positions are shown on the six major chromosome arms. Chromosome length is indicated in megabase pairs (Mb). See Supplementary Table 1 for the exact position of each gene. The normal expression pattern of these genes is indicated as follows: genes with testis-specific isoform (dark blue), genes expressed in testis and other tissues (turquoise) and genes not normally expressed in adult testis (red). See Table 1 for details
