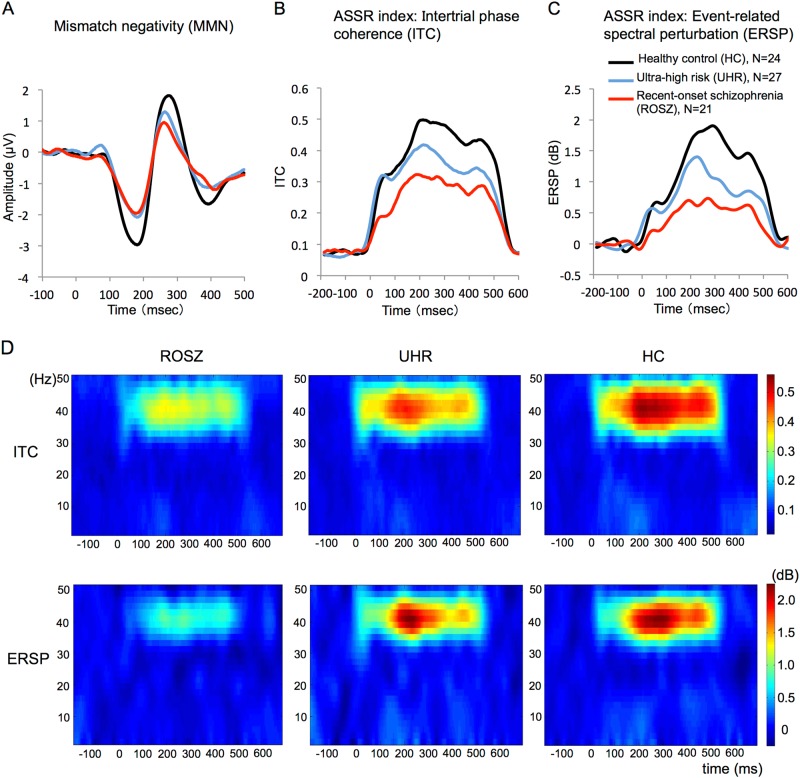
Fig. 1. Mismatch negativity, intertrial phase coherence, and event-related spectral perturbation.
The average waveforms of mismatch negativity (a), time-course of intertrial phase coherence (b), and event-related spectral perturbation (c) at the FCz. The red, blue, and black lines indicate data of participants in the recent-onset schizophrenia (ROSZ), ultra-high risk (UHR), and healthy control (HC) groups, respectively (a, b, and c). The x-axis indicates time (ms), and the y-axis indicates the amplitude of MMN (μV; a), and intertrial phase coherence (ITC; b) and event-related spectral perturbation (ERSP; dB; c) indices of auditory steady-state response (ASSR). The grand average time-frequency maps for ITC and ERSP at FCz (d). The x-axis indicates time (ms), y-axis indicates frequency (Hz), and color scale indicates intertrial phase coherence or event-related spectral perturbation at each time-frequency point (d)

