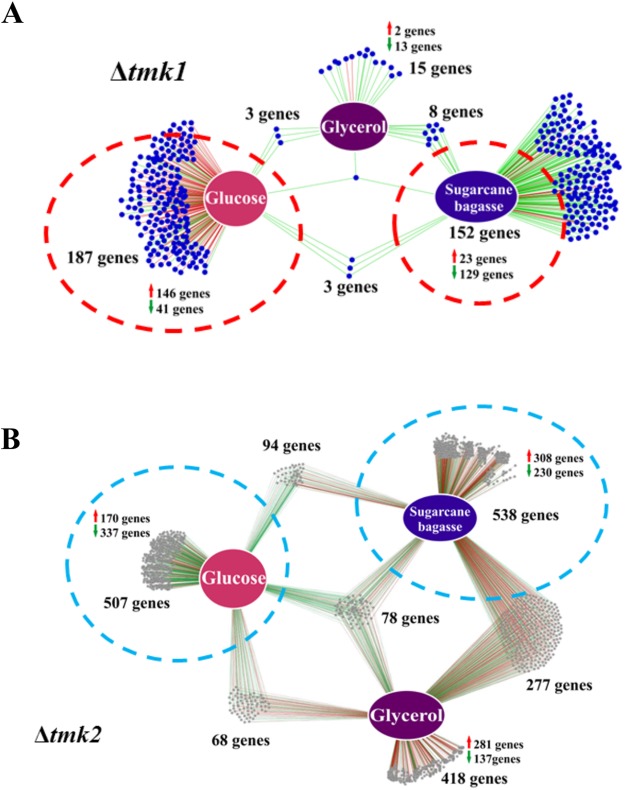
Figure 2.
Gene Regulatory Network (GRN) of differentially expressed genes in the mutant strains grown in glucose, sugarcane, and glycerol. (A) GRN of 402 differentially expressed genes in the Δtmk1 compared to the QM6a (Δtmk1/QM6a) in the presence of glucose, glycerol, and sugarcane bagasse. Genes are represented as nodes (circles), and interactions are represented as edges (red lines: upregulated interactions, green lines: downregulated interactions), connecting the nodes: 382 interactions, (B) GRN of 2575 differentially expressed genes in the Δtmk2 compared to the QM6a (Δtmk2/QM6a) in the presence of glucose, glycerol, and sugarcane bagasse. Genes are represented as nodes (shown as circles), and interactions are represented as edges (red lines: upregulated interactions, green lines: downregulated interactions), connecting the nodes: 1980 interactions.

