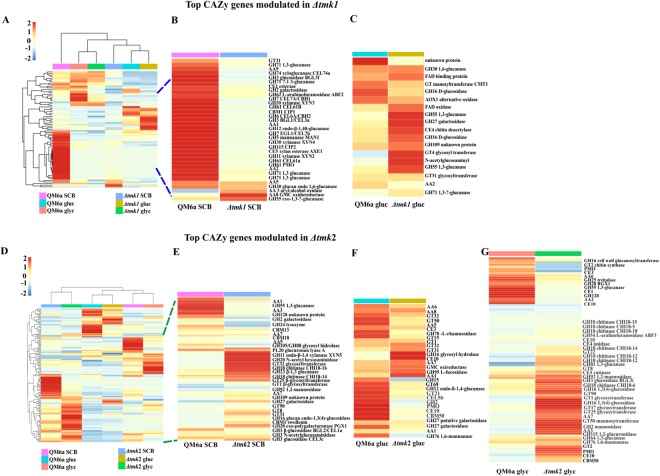
Figure 4.
Cellulase gene expression profile of T. reesei QM6a, Δtmk1, and Δtmk2 strains during growth in glucose (gluc), glycerol (glyc), and sugarcane bagasse (SCB). (A) Heatmap of differentially expressed CAZy genes in the Δtmk1 and QM6a strains showing all the conditions of this study. (B) Heatmap of differentially expressed CAZys in Δtmk1 and QM6a strains grown in sugarcane bagasse. (C) Heatmap of differentially expressed CAZys of Δtmk1 and QM6a strains grown in glucose. (D) Heatmap of differentially CAZy genes in the Δtmk2 and QM6a strains showing all the conditions of this study. (E) Heatmap of differentially expressed CAZys in Δtmk2 and QM6a strains grown in sugarcane bagasse. (F) Heatmap of differentially expressed CAZys from Δtmk2 and QM6a strains grown in glucose. (G) Heatmap of differentially expressed CAZys from Δtmk2 and QM6a strains grown in glycerol. The hierarchical clustering was performed using the R pheatmap package. Complete linkage method and Euclidean distance of row centered and scaled TPM values were used for hierarchical clustering of the differentially expressed genes in all analyzed conditions.

