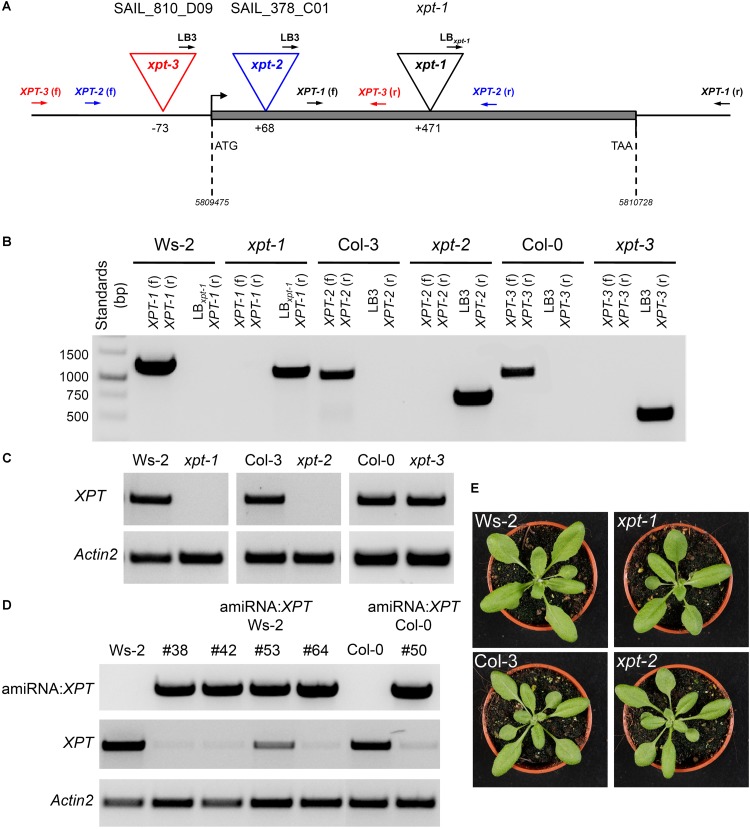
FIGURE 1.
Molecular characterization of XPT T-DNA insertion mutants and amiRNA:XPT lines in the Ws-2 or Col-0 background. (A) XPT gene structure with the individual T-DNA insertions as well as the locations of primer pairs for the identification of the inserts. (B) Amplification pattern of genomic DNA fragments using gene specific and/or T-DNA left border (LB) primers as indicated. (C) XPT expression based on RT-PCR fragments generated from RNA isolated from wild-type plants or T-DNA insertion mutants as indicated. As a control, Actin2 was used. (D) Molecular analyses of amiRNA:XPT insertion lines in the Ws-2 or Col-0 background. The upper panel shows fragments of the amiRNA:XPT construct amplified by PCR on genomic DNA of the individual lines. In the lower panels RT-PCR fragments of the XPT or actin2 (control) are displayed for the individual lines. (E) Compared to the respective wild-type plants the xpt-1 and xpt-2 mutant alleles lacked any visible phenotype when grown under SL-conditions (PFD = 150 μmol⋅m-2⋅s-1) in the long-day.

