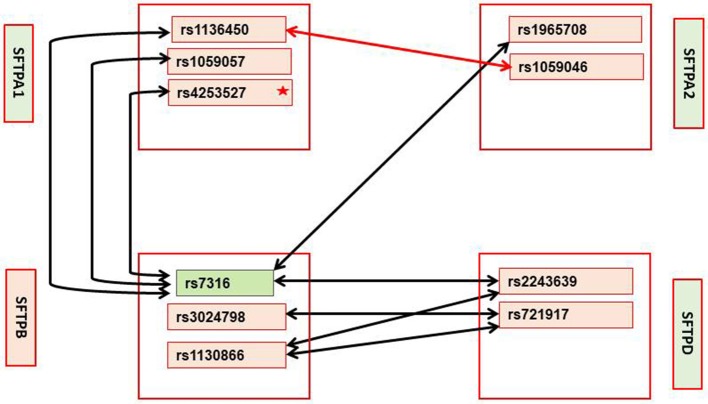
Figure 3.
Interactions in mild and moderate/severe CF subgroups with p-value < 0.01; these interactions were significant in the entire CF group after Bonferroni correction. Mild CF: Significant interactions between SFTPA1, SFTPA2, SFTPB, and SFTPD are shown with black arrows. Green box indicates the only SNP that remained significant after Bonferroni correction. Star (*) indicates that this SNP is significant at p < 0.03 by itself. Moderate/severe CF: Red arrow shows the only significant interaction at p < 0.01 that is also significant in the entire CF groups after Bonferroni correction. No significant interactions that include SNPs of the SFTPC are observed in either severity group.

