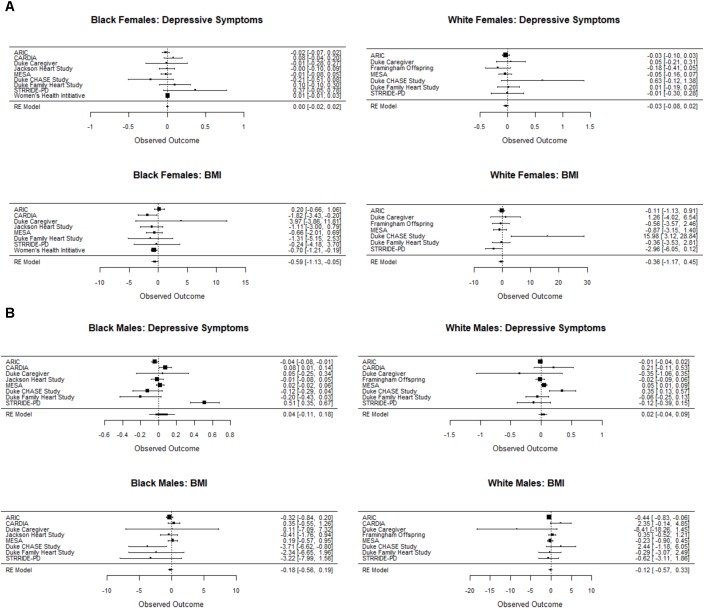
FIGURE 2.
Forest plot showing the unstandardized coefficient for the interaction between Ser/Ser vs. Cys/Cys and the stress measure for each study for the depressive symptom and BMI outcomes for females (A) and males (B). Cochrane’s Q test for between-study heterogeneity was statistically significant only for White males and Black males on the depressive symptom outcome. Coefficients were generated for each study separately using a general linear model. Results were consistent with tests of a SNP by stress by study interaction term in a random intercepts model. In the study-by-study analysis, data were too sparse in the STRRIDE AT/RT dataset to estimate the SNP by stress interaction and thus not included in the heterogeneity analysis.

