FIGURE 5.

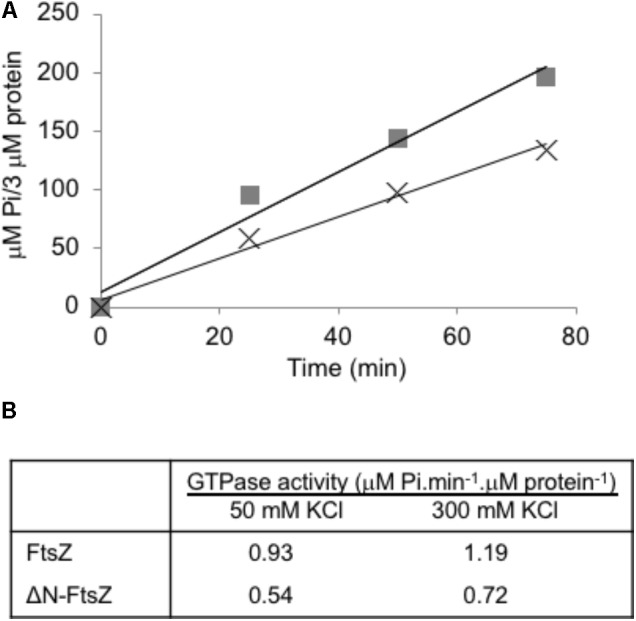
GTPase activity of Anabaena FtsZ and ΔN-FtsZ proteins. (A) GTPase activity was determined as specified in Section “Materials and Methods” with 3 μM of FtsZ (squares) or ΔN-FtsZ (crosses). At the times indicated, Pi produced was determined in aliquots of each reaction mixture. (B) GTPase activity was determined in reaction mixtures containing 3 μM protein and 50 or 300 mM KCl. Activity was calculated from the slope of the linear function as in (A). Figures are the mean of two independent assays with very similar results.
