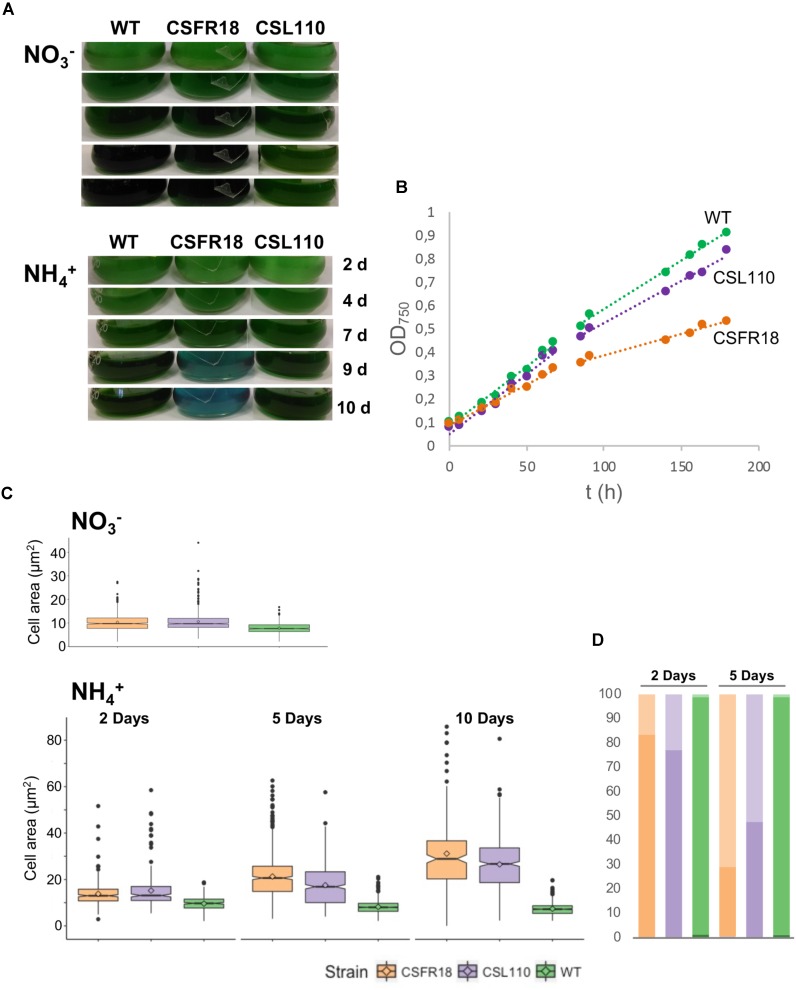
FIGURE 7.
Growth and cell size effects of ΔN-FtsZ expression in a strain depleted of FtsZ. (A) Filaments of Anabaena (WT) and strains CSFR18 (PND-ftsZ) and CSL110 (PND-ftsZ, PftsZ-Δ5′-ftsZ) grown in BG11 medium were collected and transferred to BG11 () or BG110 plus ammonium () medium, at a cell density corresponding to 0.5 μg chlorophyll/ml, in which they were incubated under culture conditions. Cultures were photographed after the indicated times of incubation (in days). Bluish color in strain CSFR18 ammonium culture is indicative of cell lysis. (B) At the indicated times in BG110 plus ammonium medium absorbance at 750 nm was measured. (Please, note that in strain CSL110, and specially in CSFR18, increase in cell size with regard to the WT would contribute to increase in turbidity). (C) Samples of the indicated cell suspensions were withdrawn, photographed under the microscope, and the obtained images (as shown in Figure 8 below) were used for cell area determination as described in Section “Materials and Methods.” 200–300 (for all strains 2 days and CSFR18 10 days in ammonium-containing medium) or 500–600 cells (all other strains and conditions) from four different cultures were measured. Tukey’s HSD (honest significant difference) and U Mann–Whitney tests were performed to assess the statistical significance of comparisons. Both parameters were 0.000 for comparisons between the different strains with a given nitrogen source (meaning significant differences), except for comparison of CSFR18 and CSL110 with nitrate (0.986 and 0.337 for Tukey’s HSD and U Mann–Whitney tests, respectively) and 2 days with ammonium (0.574 for Tukey’s HSD) (parameters higher than 0.05, meaning non-significant differences). The mean values (diamonds in the plots) after incubation with ammonium for 10 days were: WT, 7.4 ± 2.6 μm2; CSFR18, 30.7 ± 15.8 μm2; CSL110, 26.5 ± 11.9 μm2. (It should be noted that the data shown for CSFR18, 10 days correspond to the persistent cells only. However, because of extensive cell lysis, these data are not representative of the culture state). (D) From data in (C), the percentages of cells of strains CSFR18 and CSL110 with values in the 99th percentile of the WT (darker colors), and with values bigger than values in this rank (lighter colors) are represented.

