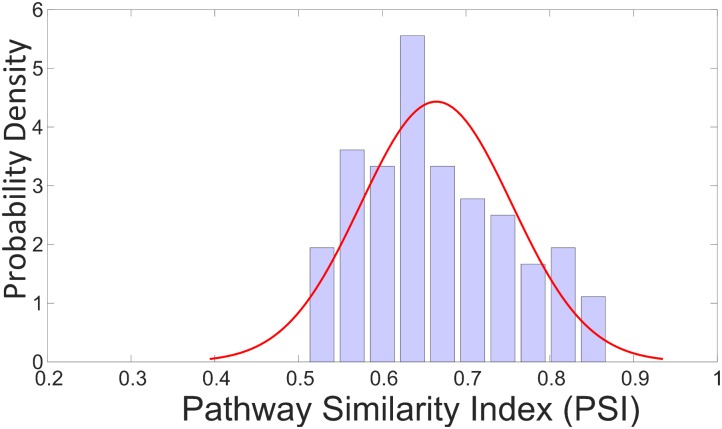
FIGURE 4.
Probability distribution of PSI values for 100 random samples of validation set. The 100 samples are selected from the 25% holdout samples of TG-GATEs (validation set) keeping the distribution of categories same as original. The average of these PSI values was 0.64 with most of the values located between 0.6 and 0.8 and none of the values below 0.5.

