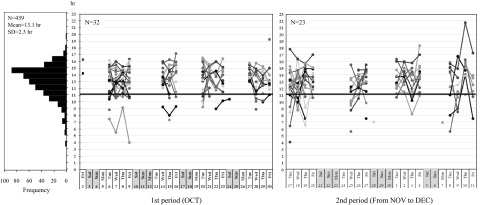
Fig. 2.
Day-to-day variations in the daily rest period (DRP) between working days during the one-month study periods. The vertical axis shows DRP length, while the horizontal axis shows the day of month. Each plotted line represents individual variations (55 participants) in DPRs. The bold horizontal line indicates the minimum 11-hour DRP length, which is set as an EU working directive standard. The histogram on the left shows the frequency of DRP lengths during the study (Total DRPs observed: N= 439).

