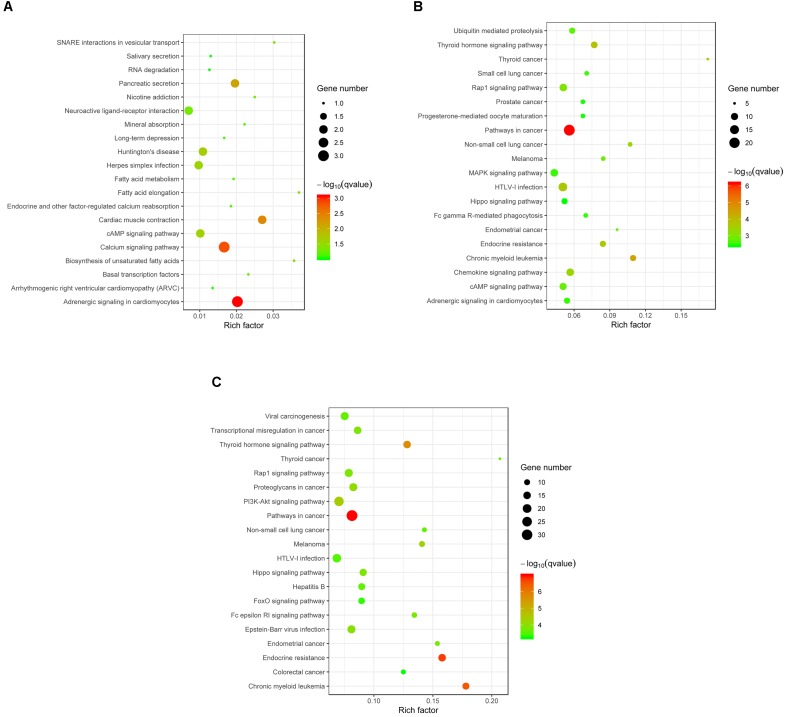
FIGURE 4.
KEGG analysis of the differentially expressed miRNAs (P < 0.05) revealed significant enrichment in immune-related pathways. The top 20 enriched pathways of the differentially expressed miRNAs are presented for (A) “Acute vs. Uninfected,” (B) “Chronic vs. Uninfected” and (C) “Chronic vs. Acute.” The degree of KEGG enrichment was determined by the enrichment factor, q-value, and miRNA gene target number. The sizes and colors of the spots represent the number of predicted gene targets of the differentially expressed miRNAs (P < 0.05) and the q-value, respectively.

