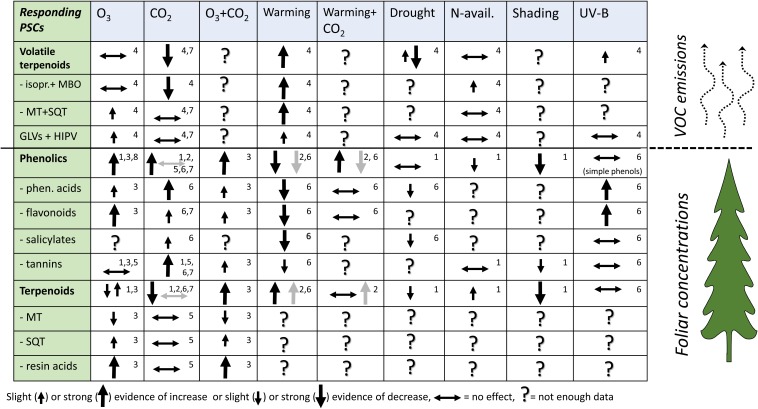
FIGURE 2.
Summary of the results in comprehensive reviews and meta-analyses of plant PSCs responses in their concentration or emissions in forest trees under climate change related stresses. This tabulation covers nearly 400 original scientific articles. Type of stresses: O3 = elevated ozone, CO2 = elevated carbon dioxide, UV-B = elevated UV-B radiation. The tabulation gives the direction of PSC responses to single environmental factors, except for the combined O3+CO2 and CO2+warming effects. Arrow direction (increase or decrease) shows the effect size (significant or highly significant effect in meta-analysis) or the amount of evidence in reviews. Horizontal bidirectional arrow indicates the studies with non-significant results and up and down arrows in the same cell indicate significant results in both directions dominate. Question mark indicates that the reviews and meta-analyses did not provide enough data. Gray arrows in CO2, warming and CO2+warming columns indicate woody tissue responses as specified in reference 2. Small numbers in the upper-right corner of reach cell indicate the source reference: 1 = Koricheva et al., 1998; 2 = Zvereva and Kozlov, 2006; 3 = Valkama et al., 2007; 4 = Peñuelas and Staudt, 2010; 5 = Lindroth, 2012; 6 = Julkunen-Tiitto et al., 2015; 7 = Robinson et al., 2012; 8 = Li et al., 2017. References 1–3 and 7–8 are meta-analyses and 4–6 literature reviews. Meta-analyses give the size of the effect, and the reviews give the frequency of observations in each response categories (–, 0, +).

