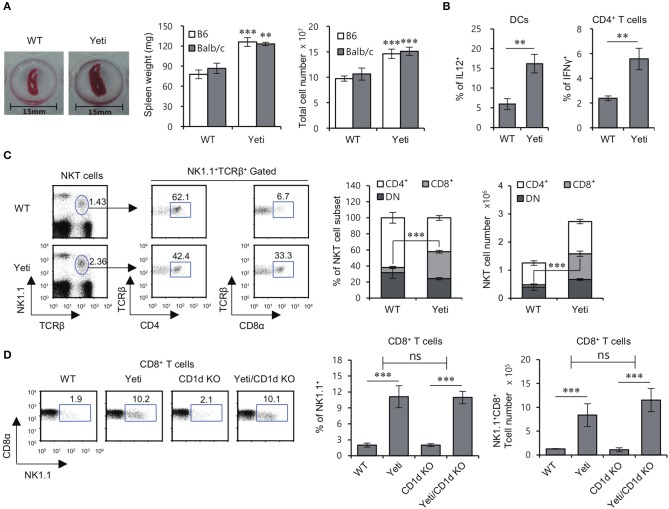
Figure 1.
Altered NKT cell subsets in Yeti mice. (A) Left, a representative picture of the spleens from 8-week-old WT B6 and heterozygous Yeti B6 mice. Middle and Right, Spleen weight and splenocyte number in Yeti B6 and Yeti Balb/c mice, as compared with WT B6 and Balb/c mice. (B) Intracellular IL12 production by isolated DCs (CD11c+) from WT B6 and Yeti B6 mice was assessed by flow cytometry. Intracellular IFNγ production was assessed in splenic CD4+ T cells from WT B6 or Yeti B6 mice by flow cytometry. (C) The percentage of NK1.1+TCRβ+ cells among splenocytes and the percentage of either CD4+ or CD8α+ populations among NK1.1+ T cells from 8-week-old WT and Yeti mice are plotted. The proportion and absolute cell numbers of CD4+, CD8+, and DN NK1.1+ T cells were assessed in WT and Yeti mice at the age of 8 weeks. (D) The percentage of NK1.1+ populations among CD8α+ T cells from 8-week-old WT, Yeti, CD1d KO, and Yeti/CD1d KO mice are plotted. The mean values ± SD (n = 4 per group in the experiment; Student's t-test; **P < 0.01, ***P < 0.001) are shown. Two-way ANOVA (Yeti × iNKT) showed an interaction between these two factors (ns, not significant).

