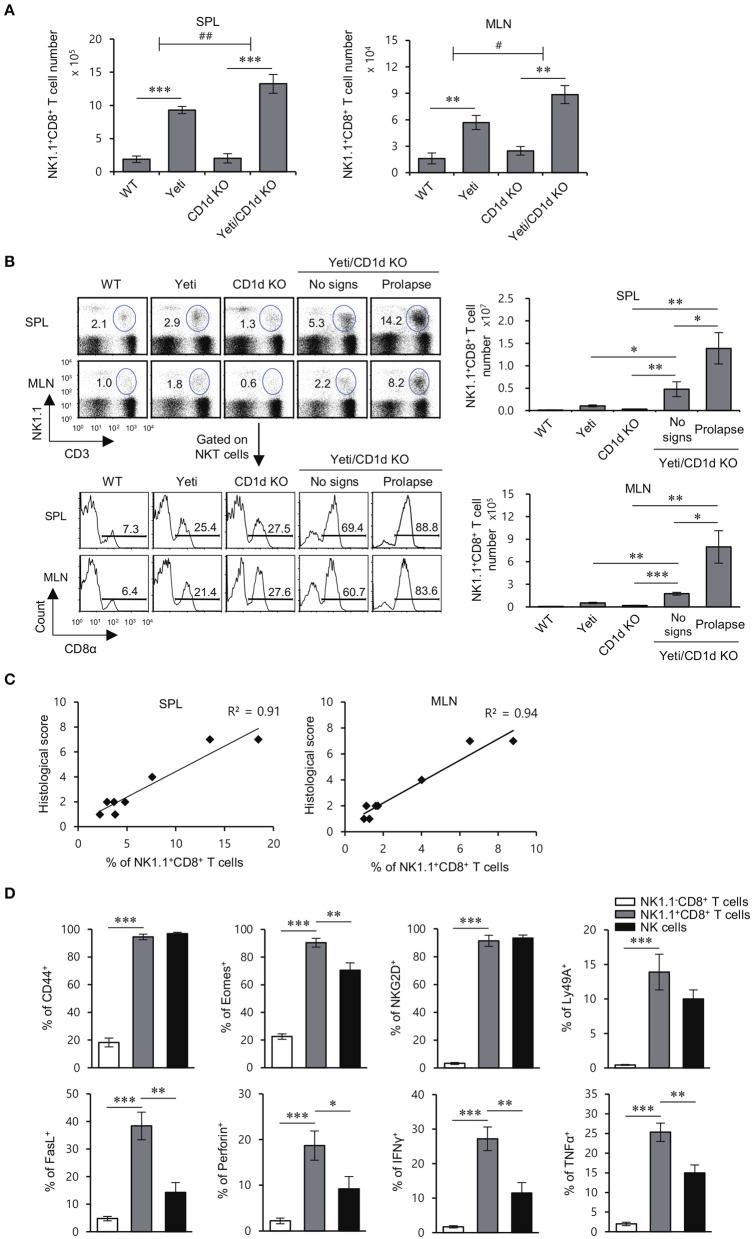
Figure 3.
The development of colitis in Yeti/CD1d KO mice is associated with increased numbers of NK1.1+CD8+ T cells. The spleen and MLN were obtained from 1.5% DSS-treated WT, Yeti, CD1d KO, and Yeti/CD1d KO mice at day 10. (A) The absolute numbers of NK1.1+CD8+ T cells in the indicated tissues from these mice were assessed by flow cytometry at day 10. The mean values ± SD (n = 5 per group in the experiment; Student's t-test; **P < 0.01, ***P < 0.001) are shown. Two-way ANOVA (Yeti × iNKT) showed an interaction between these two factors (#P < 0.05, ##P < 0.01). (B,C) The spleen and MLN were isolated from WT, Yeti, CD1d KO, and Yeti/CD1d KO mice at 12 weeks after initiation of conventional housing conditions. (B) Upper left, the percentage of NK1.1+CD3+ cells among splenocytes and MLN cells of these mice was determined at week 12. Lower left, the frequency of the CD8α+ population among NK1.1+CD3+ cells from the spleen and MLN of these mice was determined at week 12. Right, the absolute numbers of NK1.1+CD8+ T cells in the spleen and MLN were assessed by flow cytometry at week 12. (n = 5 for WT, Yeti, and CD1d KO mice; n = 5 for Yeti/CD1d KO mice (no signs); n = 3 for Yeti/CD1d KO (prolapse); Student's t-test; *P < 0.05, **P < 0.01, ***P < 0.001). (C) Scatter graphs and linear regression analysis of the relationship between the frequency of NK1.1+CD8+ T cells among total splenocytes or MLN cells and histological score of colon tissue sections in Yeti/CD1d KO mice. The Pearson's correlation coefficient (R2) for each plot is indicated. (n = 5 for Yeti/CD1d KO mice (no signs); n = 3 for Yeti/CD1d KO (prolapse)). (D) The expression of CD44, Eomes, NKG2D, Ly49a, FasL, perforin, IFNγ, and TNFα among NK1.1−CD8+ T cells, NK1.1+CD8+ T cells, and NK cells of the MLN from 1.5% DSS-treated Yeti/CD1d KO mice was evaluated by flow cytometry on day 10. The mean values ± SD (n = 4 in A–C; n = 5 in D; per group in the experiment; Student's t-test; *P < 0.05, **P < 0.01, ***P < 0.001) are shown.

